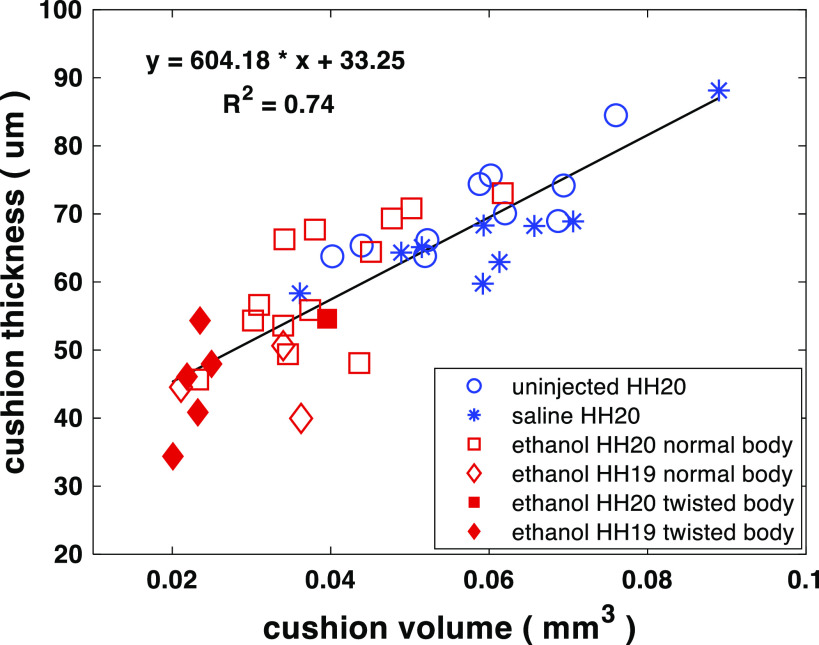
Figure 7.
Scatter plot of average cushion thickness vs. total cushion volume for ethanol-exposed, saline-treated, and uninjected embryos. Cushion thickness is linearly correlated with total cushion volume. The embryos with twisted bodies from the ethanol group clustered at the left bottom corner representing the smallest and thinnest cushions. Numbers of embryos in the three groups: untreated (n = 10 at HH stage 20), saline-treated (n = 9 at HH stage 20), and ethanol-treated (n = 14 at HH stage 20; n = 8 at HH stage 19). n, number of embryos. HH, Hamburger–Hamilton.

