
Figure 4.
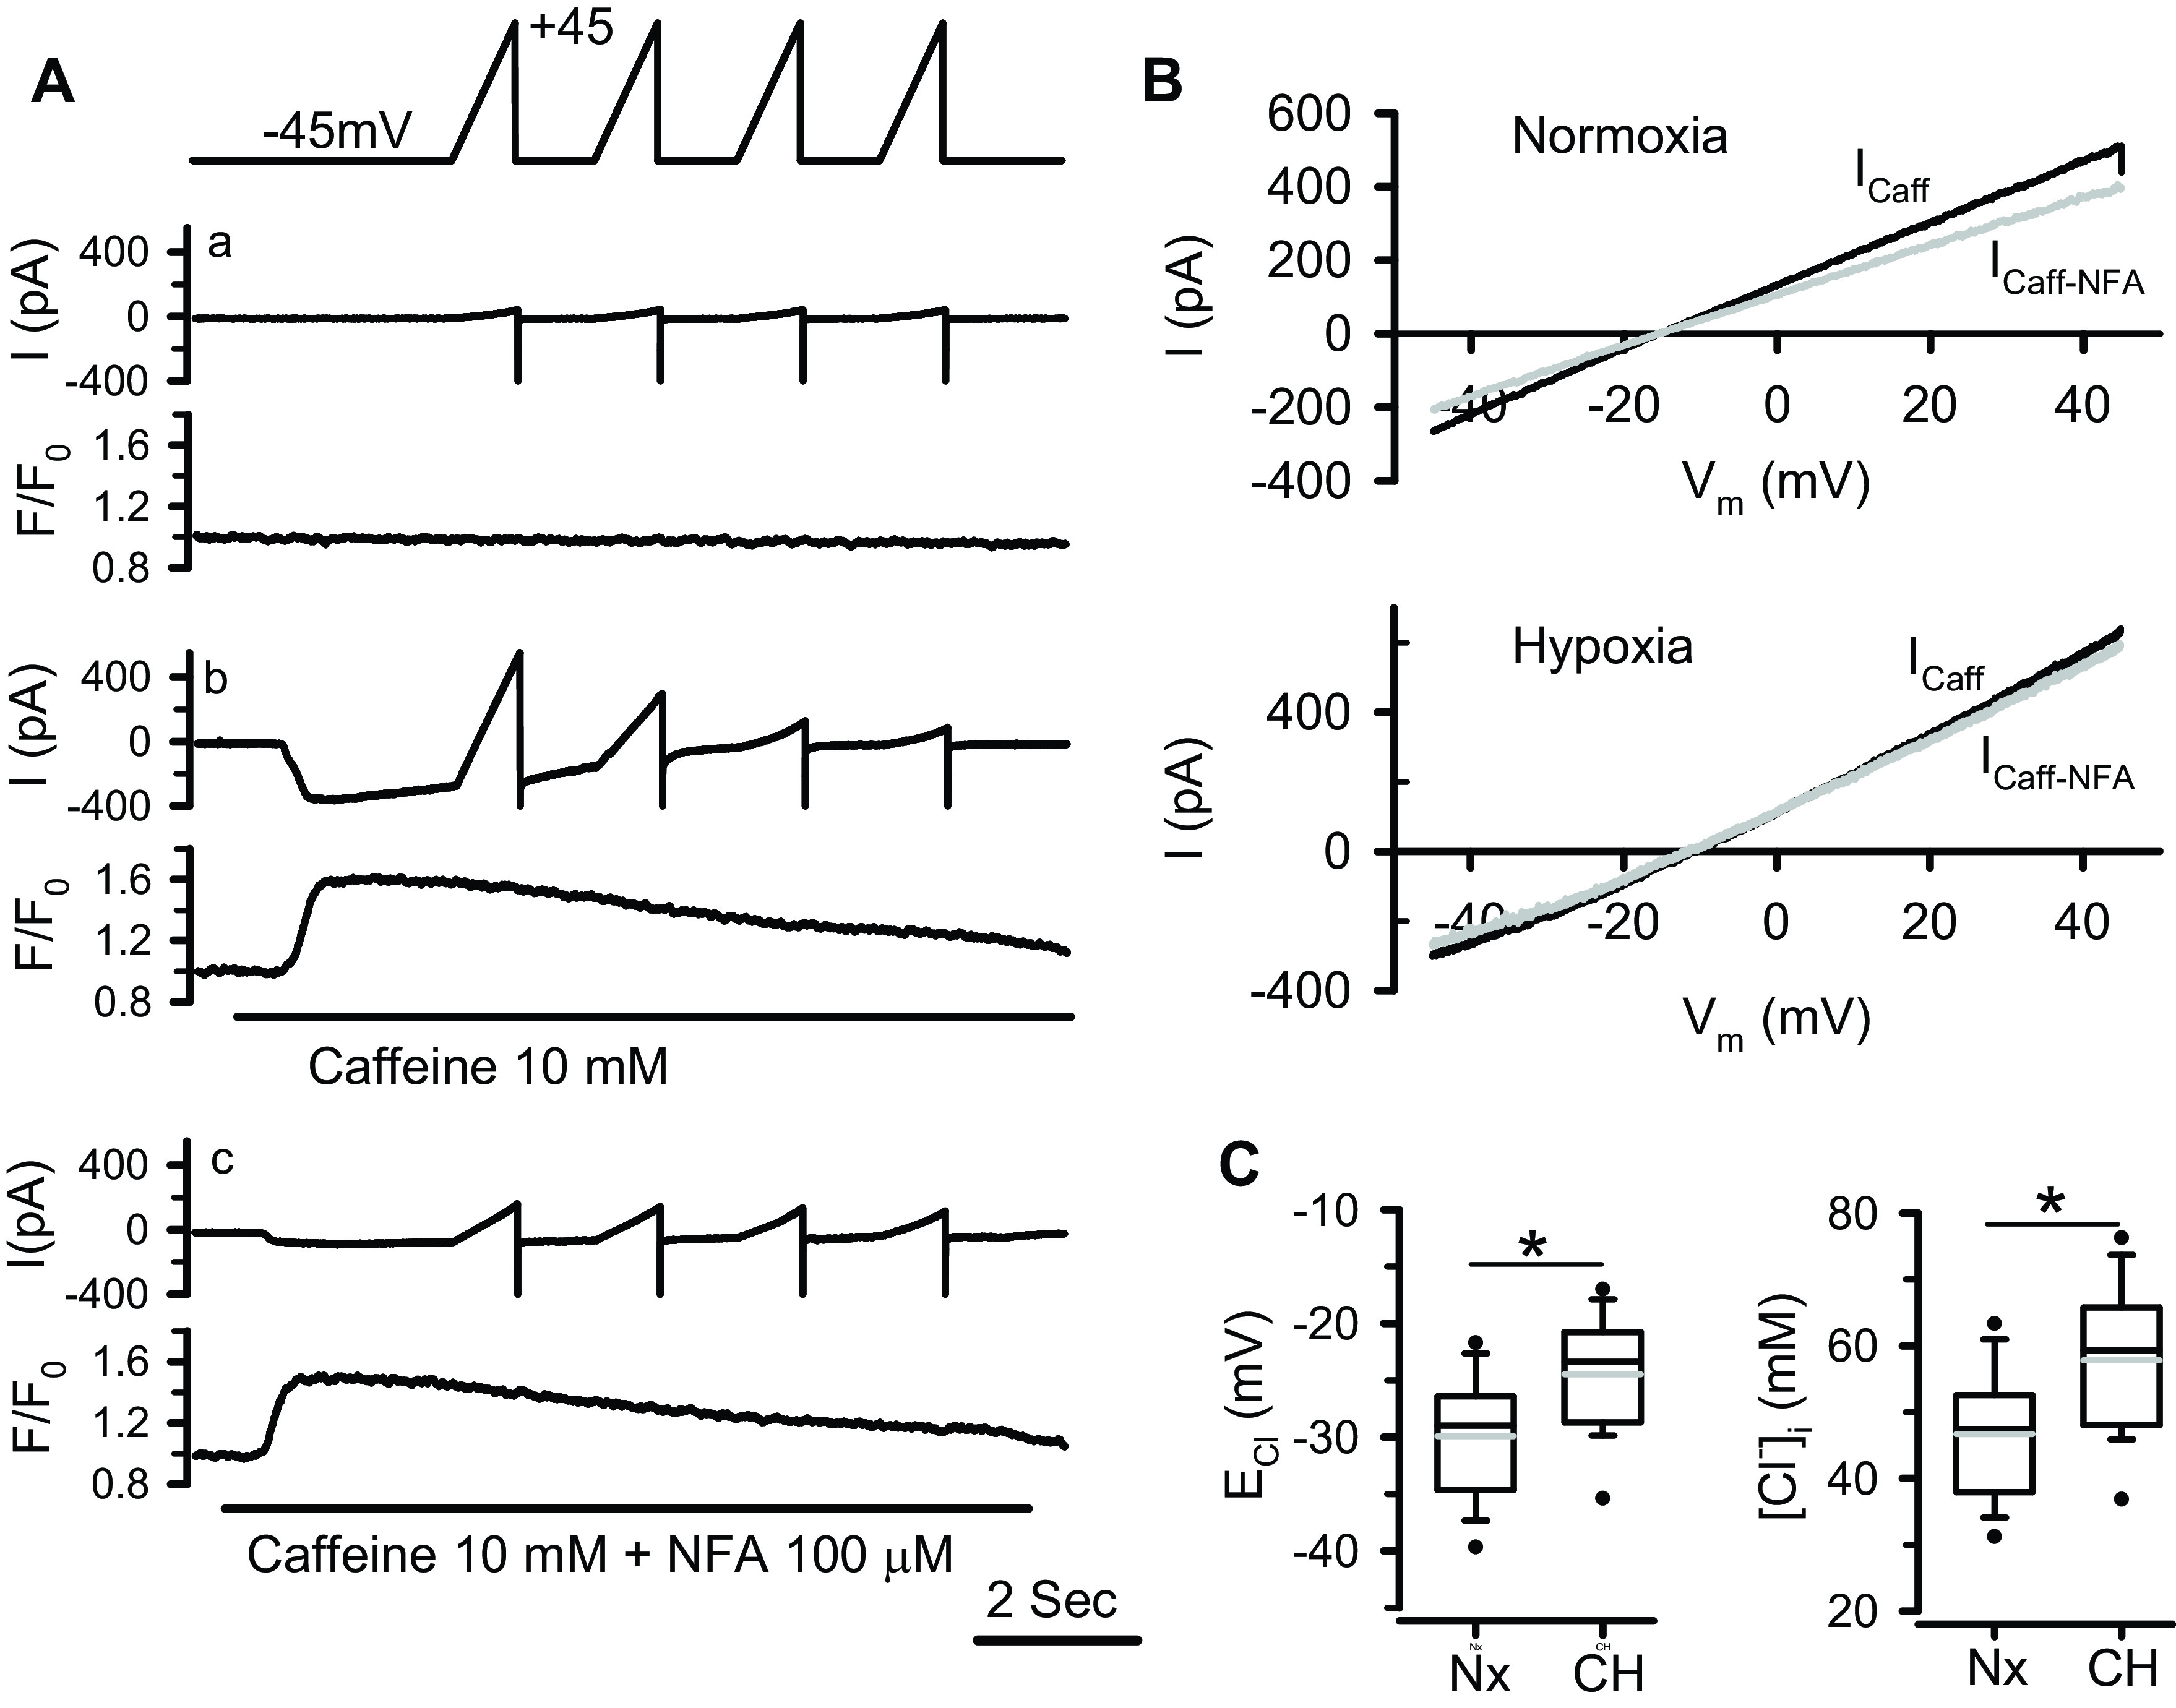
Determination of [Cl−]i by measuring the ICl.Ca reversal potential (ECl) in normoxic and chronic hypoxic (CH) pulmonary arterial smooth muscle cells (PASMCs) with gramicidin-perforated patch clamp technique. A: simultaneously recorded membrane currents and Ca2+ signals from a normoxic cell under control conditions (without drug application, a), during rapid application of 10 mM caffeine (b), or combined 10 mM caffeine and 100 µM niflumic acid (NFA, c). Membrane currents were elicited by four consecutive voltage ramps from −45 to +45 mV shown on the top. B (top): shows the I-V relationship of caffeine-induced current (Icaff) obtained by subtracting the background current (Aa) from the current recorded during caffeine-induced Ca2+ transient (Ab), and NFA-sensitive caffeine-induced current (Icaff-NFA) obtained by subtracting the current recorded during combined caffeine and NFA application (Ac) from that recorded during caffeine application (Ab). The Icaff and Icaff-NFA elicited by the first voltage ramp were plotted. B (bottom): shows the I-V relationship of Icaff and Icaff-NFA elicited by the first voltage ramp from a chronic hypoxic PASMC. C, left: box-and-whisker plot for the values of ECl (the reversal potential of Icaff-NFA) measured from normoxic (Nx, n = 33 cells) and hypoxic (CH, n = 36 cells) PASMCs. The values were corrected for the junction potential (10.8 mV). C, right: box-and-whisker plot for the values of [Cl−]i derived from the measured ECl for normoxic and hypoxic groups. Horizontal lines of boxes represent 25th percentile, median, and 75th percentile. Whiskers represent 10th/90th percentile. The gray lines inside the box represent the mean values. *P < 0.001 (unpaired t test).