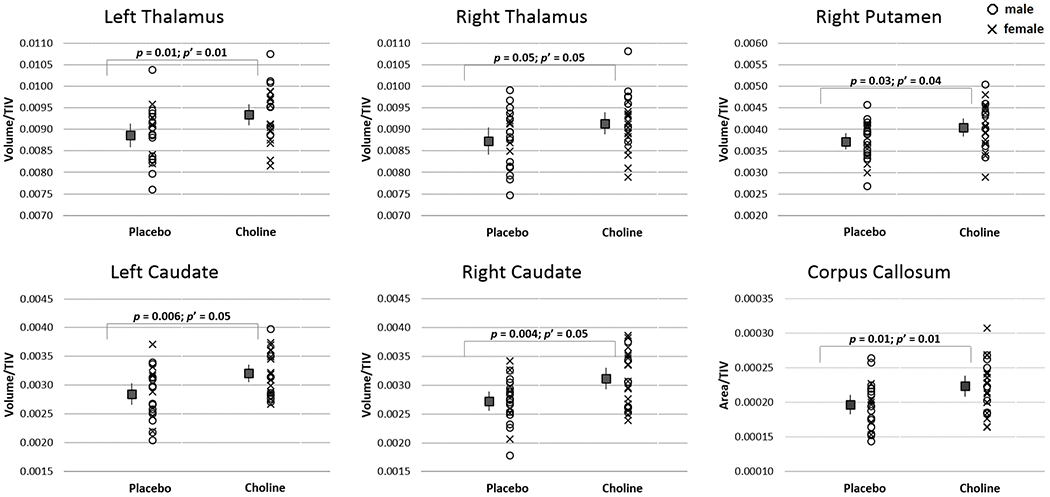
Figure 2.

Mean ± 95% confidence intervals of volumes (or areas), normalised to TIV, for regions showing a difference (p ≤ 0.05) between choline- and placebo-treated infants (choline: n = 24; placebo: n = 22). p: from t test; p’: from ANCOVA after adjustment for confounders. Scatterplots show the distribution of sex in the treatment groups.
