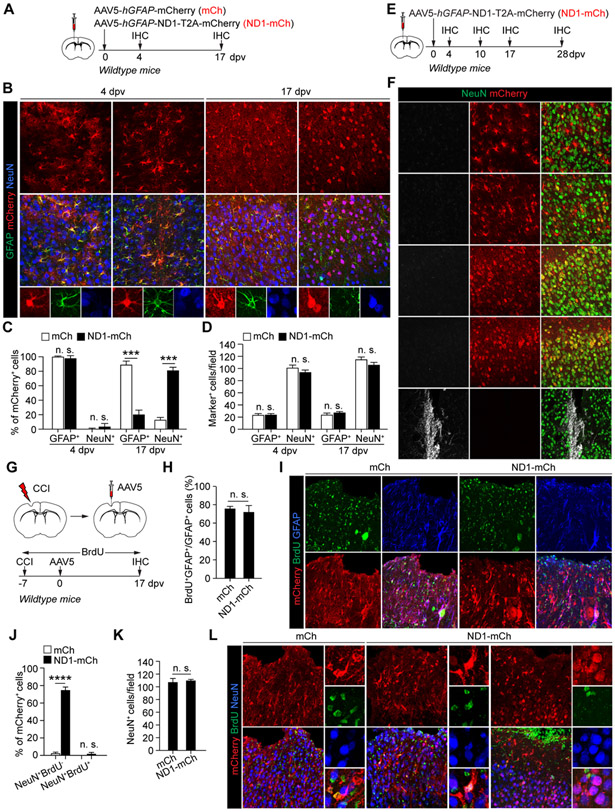
Figure 1. NEUROD1-induced reporter+ neurons neither pass through an immature stage nor come from reactive astrocytes.
(A) Study design to examine AtN conversion. IHC, immunohistochemistry; dpv, days post virus-injection.
(B) Confocal images of the indicated markers. Scales, 50 μm.
(C) Efficient induction of mCherry+ neurons by NEUROD1 (n = 3-4 mice per group per time-point; mean ± SEM; ***p<0.001; n.s., not significant).
(D) Cell numbers in virus-injected cortex (n = 3-4 mice per group per time-point; mean ± SEM; n.s., not significant).
(E) Study design to examine immature neurons.
(F) Confocal images showing a lack of DCX+ cells in virus-injected cortex. Cells in the lateral ventricle (LV) are used as controls. Scales, 50 μm.
(G) Study design to trace reactive cells. BrdU was delivered through drinking water. CCI, controlled cortical impact.
(H) Robust BrdU-labeling of reactive astrocytes (n = 4 mice per group; mean ± SEM; n.s., not significant).
(I) Confocal images of BrdU-labeled cells. Scales, 50 μm.
(J) Quantification of mCherry+ cells (n = 4 mice per group; mean ± SEM; ****p < 0.0001; n.s., not significant).
(K) Quantification of neurons in virus-injected cortex (n = 4 mice per group; mean ± SEM; n.s., not significant).
(L) Confocal images of the indicated markers. A BrdU+ astrocyte-like NeuN+ cell is shown in ND1-mCh group. Scales, 50 μm.

