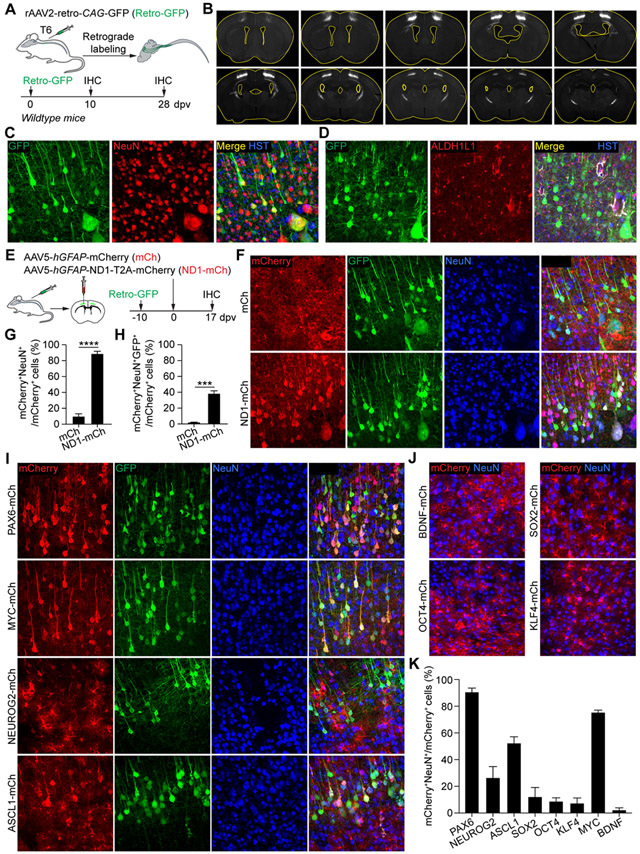
Figure 5. Virus-induced reporter+ neurons are endogenous neurons.
(A) Study design to label corticomotor neurons. T6, the 6th thoracic spinal cord level.
(B) Series of brain sections showing retrograde labeling of the motor cortex. Ventricles are outlined. Scale, 1 mm.
(C) Confocal images of the motor cortex showing GFP-traced neurons. Scales, 50 μm.
(D) Confocal images showing a complete lack of GFP-traced astrocytes in the motor cortex. Scale, 50 μm.
(E) Study design to determine the contribution of endogenous neurons to virus-induced mCherry+ neurons.
(F) Confocal images of the motor cortex showing reporter-labeled neurons. Arrowheads show examples of neurons with dual reporters. Scales, 50 μm.
(G) Quantifications showing robust induction of mCherry+ neurons by NEUROD1 in the cortex (n = 4-5 mice per group; mean ± SEM; ****p < 0.0001).
(H) Quantifications showing endogenous neurons as the cell source for NEUROD1-induced mCherry+ neurons (n = 4-5 mice per group; mean ± SEM; ***p = 0.0002).
(I) Confocal images showing reporter-labeled cortical neurons using study designs as shown in panel E. Arrowheads show examples of neurons with dual reporters. Scales, 50 μm.
(J) Confocal images showing examples of factors with minimal induction of mCherry+ neurons. Scales, 50 μm.
(K) Quantifications of the indicated factors for their ability to induce mCherry+ neurons (n = 4 mice per group; mean ± SEM).

