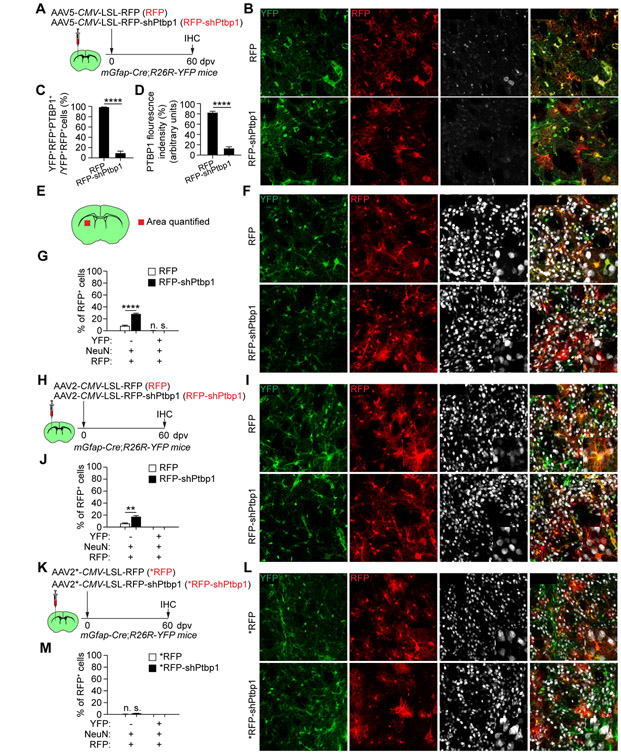
Figure 7. PTBP1 knockdown fails to convert striatal astrocytes in vivo.
(A) Study design. Striatal astrocytes were constitutively traced with YFP.
(B) Confocal images of the indicated markers. Scales, 50 μm.
(C, D) Quantifications showing robust and efficient PTBP1 knockdown (n = 4 mice per group; mean ± SEM; ****p < 0.0001).
(E) A schematic showing the striatal region for analysis
(F) Confocal images of the indicated markers. Scales, 50 μm.
(G) Quantifications showing a lack of YFP-traced RFP+ neurons (n = 4 mice per group; mean ± SEM; ****p < 0.0001).
(H) Study design. Striatal astrocytes were constitutively traced with YFP.
(I) Confocal images of the indicated markers. Scales, 50 μm.
(J) Quantifications showing a lack of YFP-traced RFP+ neurons (n= 4 mice per group; mean ± SEM; **p = 0.0056).
(K) Study design. AAV2 viruses were from Fu laboratory. Striatal astrocytes were constitutively traced with YFP.
(L) Confocal images of the indicated markers. Scales, 50 μm.
(M) Quantifications showing a lack of YFP-traced RFP+ neurons (n = 4 mice per group; mean ± SEM; n.s., not significant).
See also Figures S6 and S7.

