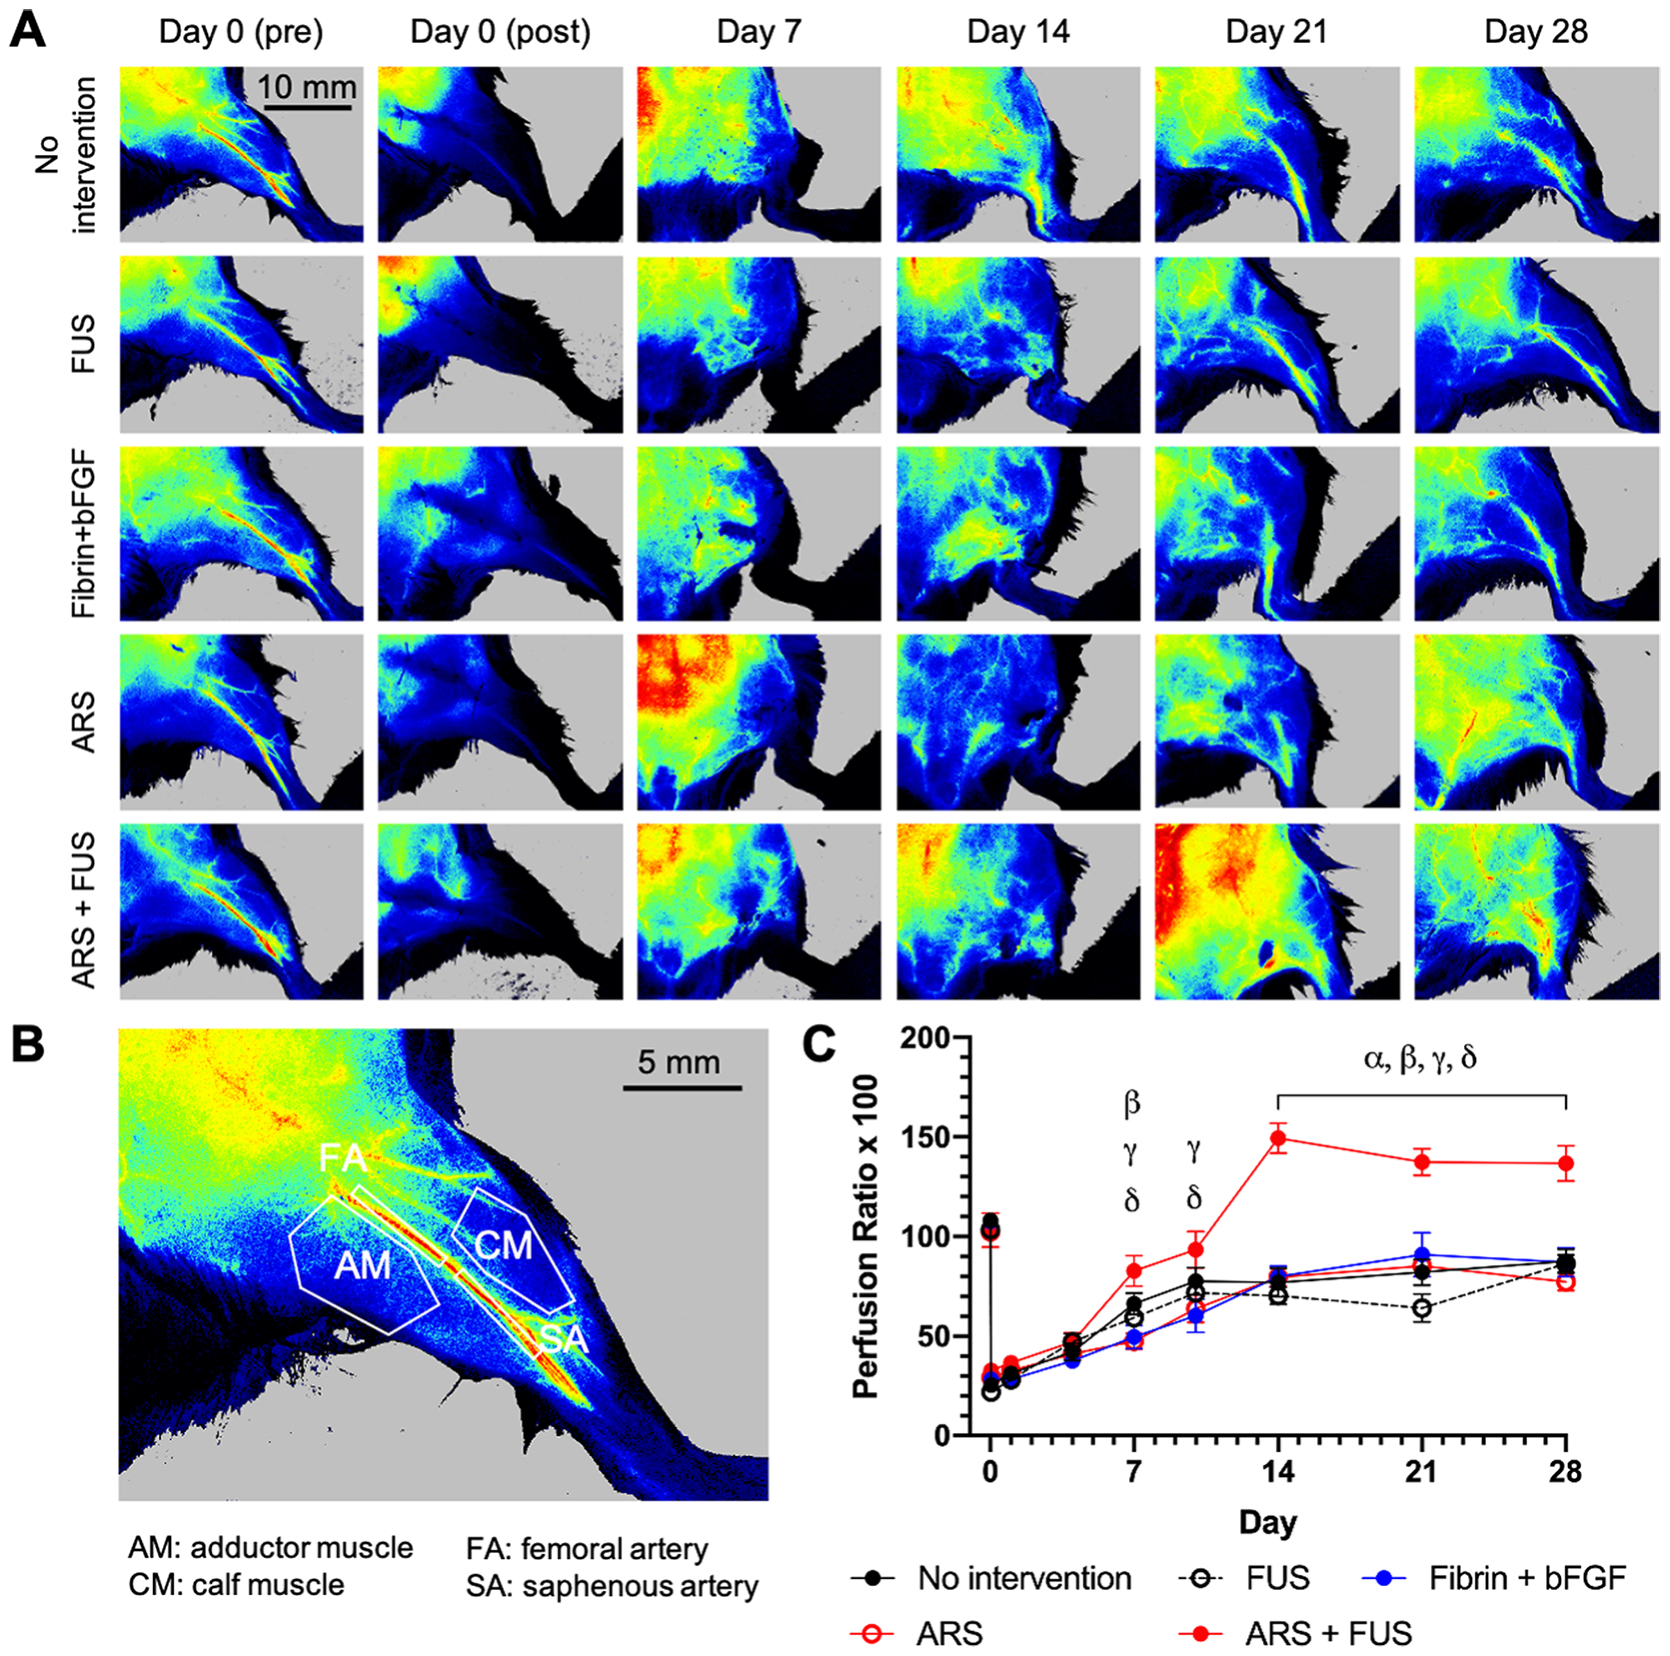
Figure 4.

Perfusion was longitudinally tracked using laser speckle contrast analysis (LASCA) imaging. A) Representative, longitudinal images of mice from the five experimental groups are shown. B) Perfusion was assessed in four different regions of interest (ROIs) within the leg as well as in the foot (not shown). This image shows a leg prior to surgery. C) For each ROI, a perfusion ratio was calculated by normalizing the average relative perfusion in the ischemic limb by the normal limb. The longitudinal profiles for the calf muscle ROI are shown. Data are represented as mean ± standard error of the mean (N=12–13 per group for days 0–14 and N=6 for days 21–28). Statistically significant differences (p < 0.05) are denoted as follows. α: no intervention vs. ARS +FUS; β: FUS vs. ARS + FUS; γ: fibrin + bFGF vs. ARS + FUS; and δ: ARS vs. ARS + FUS.
