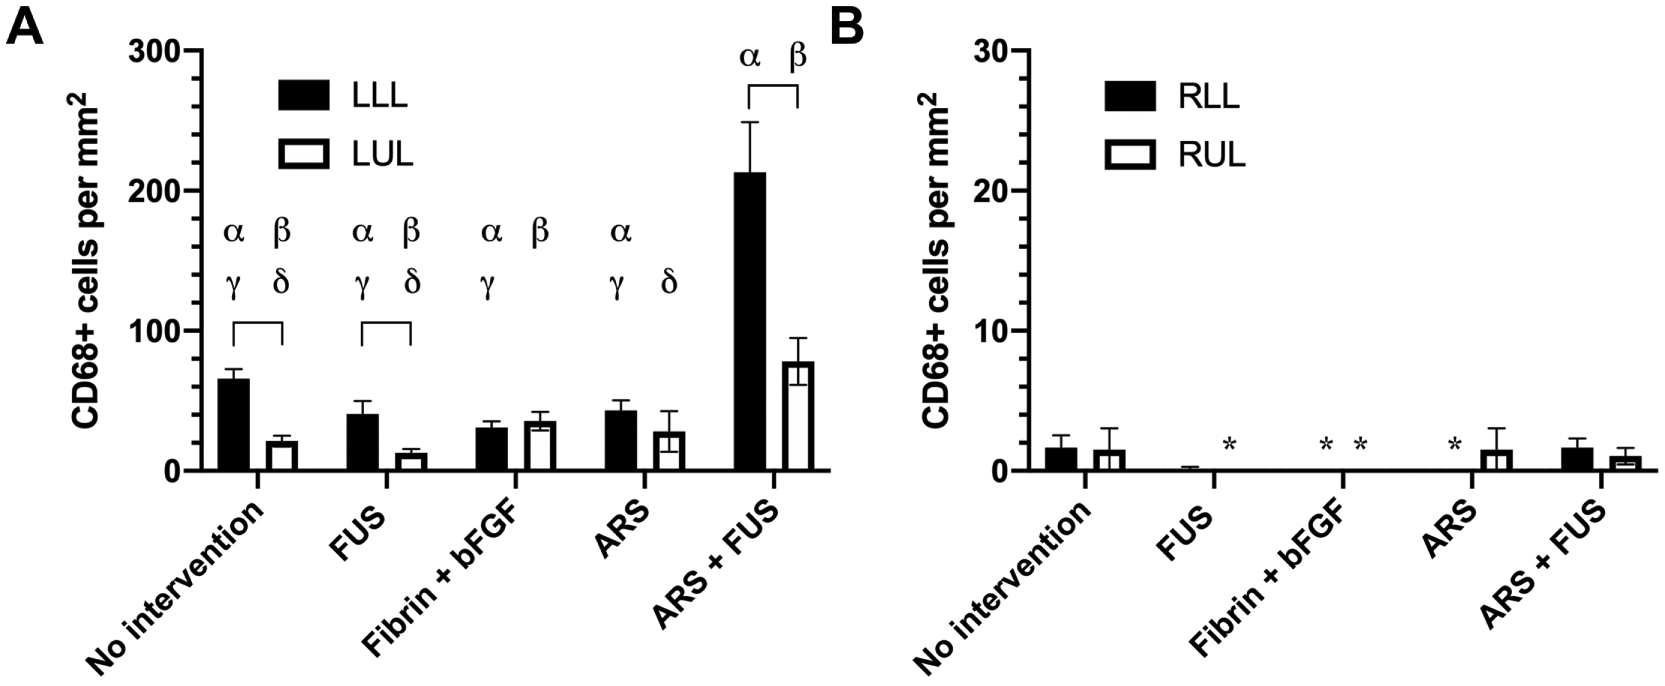
Figure 7.

The density of macrophages was assessed using CD68 immunohistochemistry on day 28 within the left (A) and right legs (B). Four different regions of muscle were analyzed: left lower leg (LLL), left upper leg (LUL), right lower leg (RLL), and right upper leg (RUL). Data are represented as mean ± standard error of the mean (N=6 per group). An asterisk (*) denotes each group where zero CD68+ cells were counted. Statistically significant differences (p < 0.05) are denoted by brackets as well as the following symbols. α: LLL vs RLL; β: LUL vs. RUL; γ: vs. ARS + FUS (LLL); and δ: vs. ARS + FUS (LUL).
