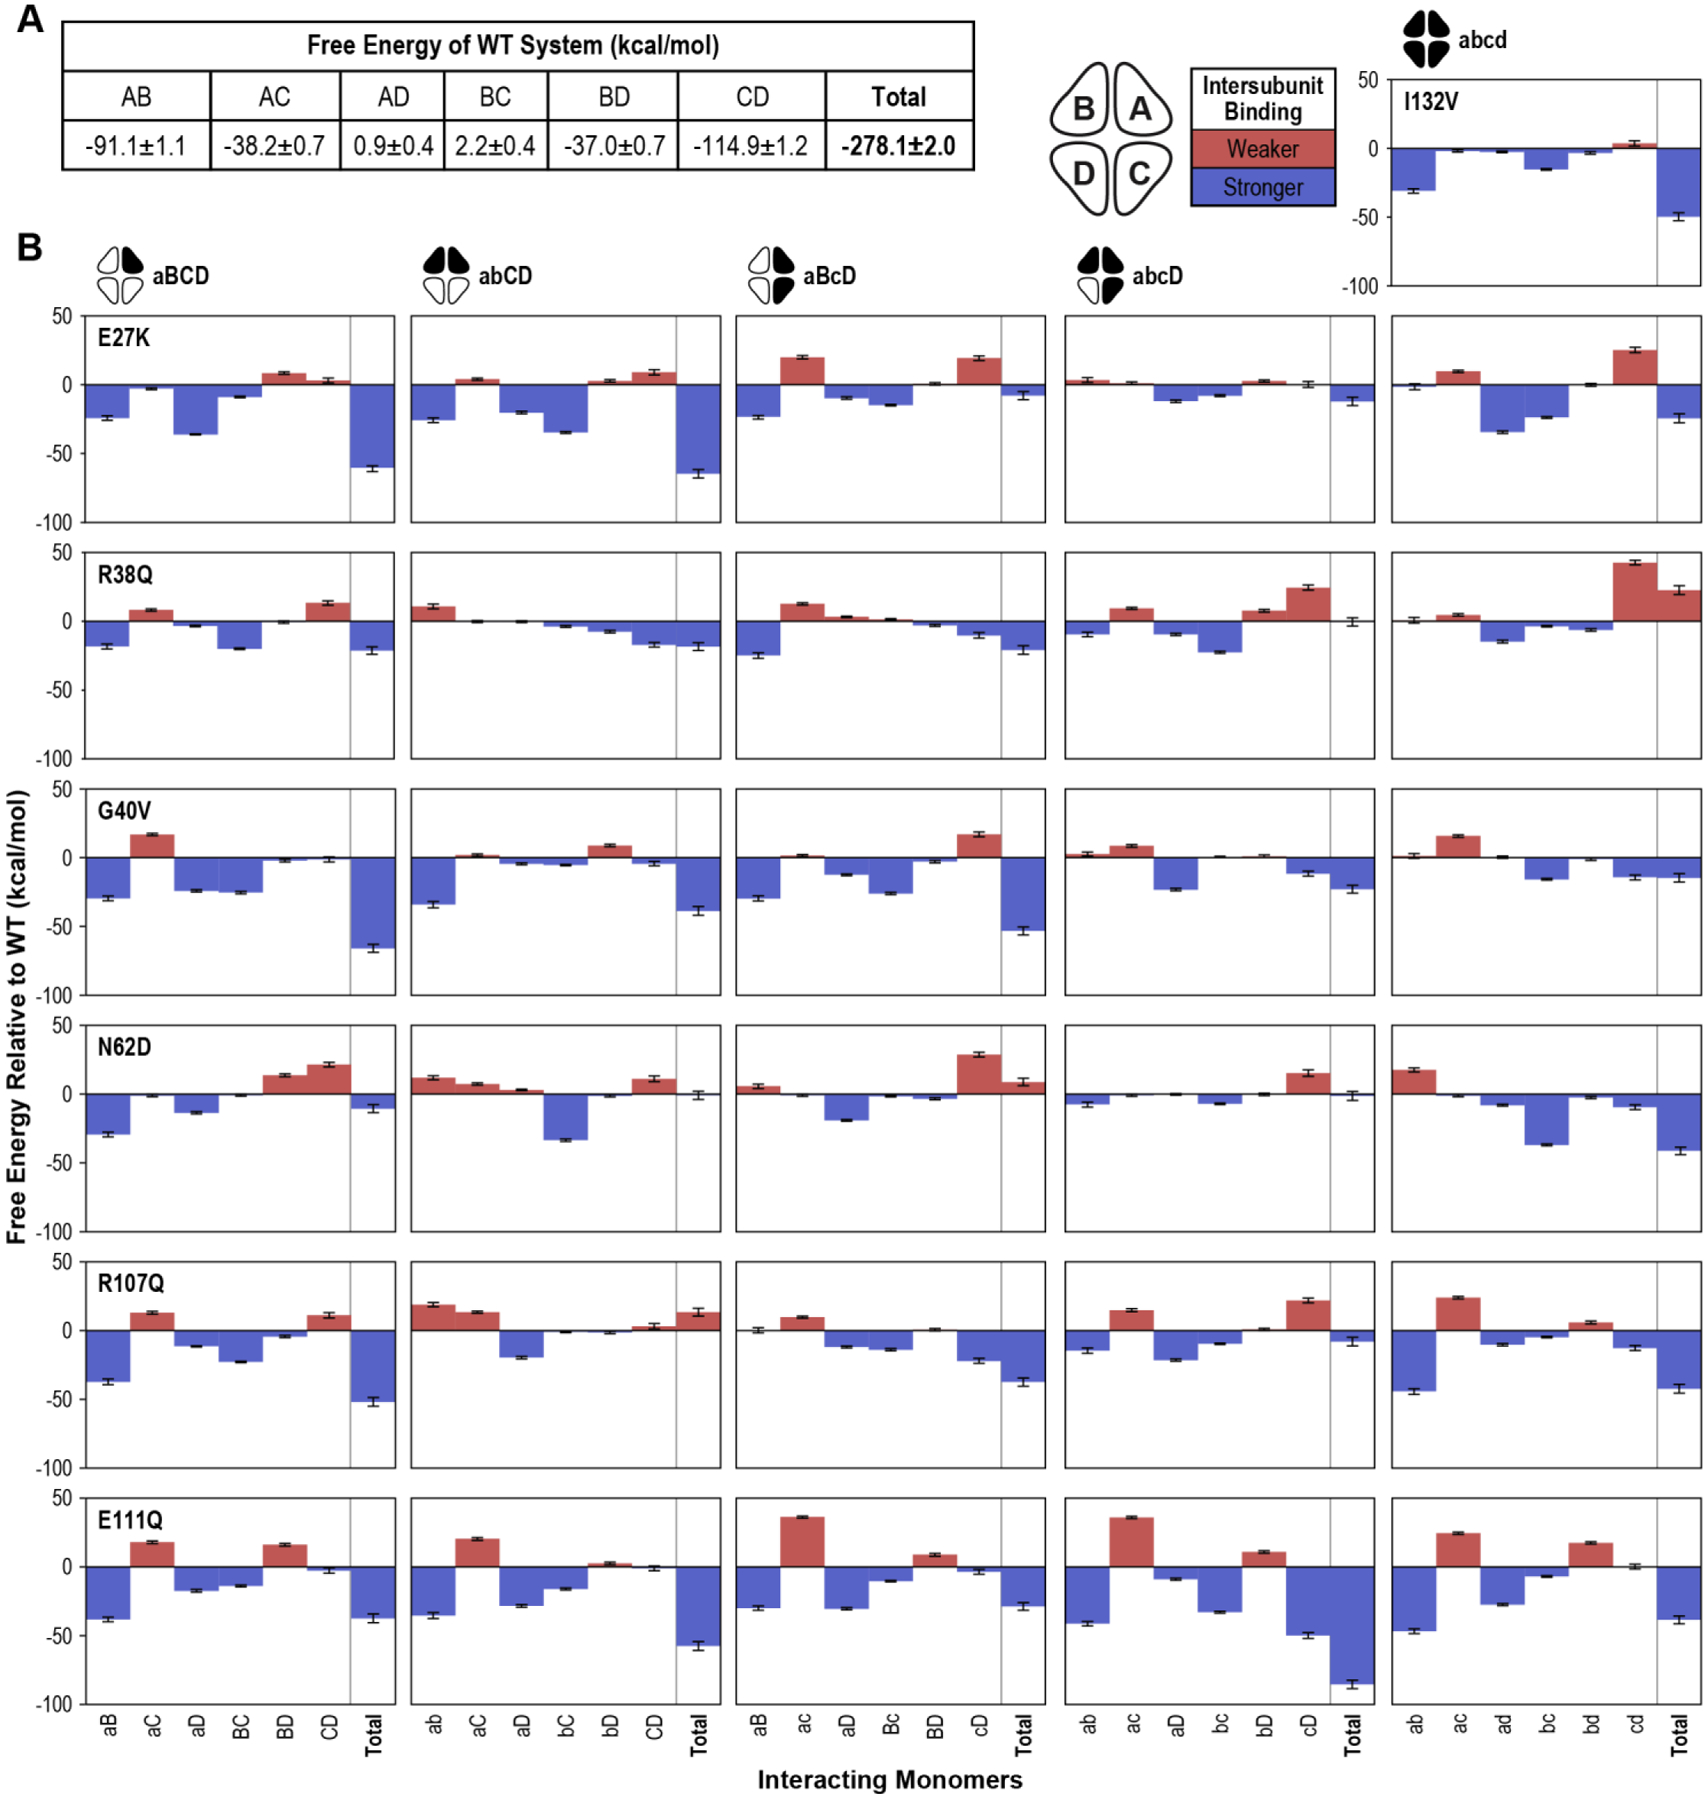
Figure 3. Binding Free Energy.

(A) Averaged interaction free energy values for the WT tetramer system were calculated for the final 100 ns of the simulation. Free energy values of each monomer pair as well as the total system are shown. (B) The average free energy values for each variant tetramer system with the corresponding WT value subtracted are plotted. Positive (red) bars indicate weaker binding than WT; negative (blue) bars indicate stronger binding. Error values and bars represent standard error of the mean.
