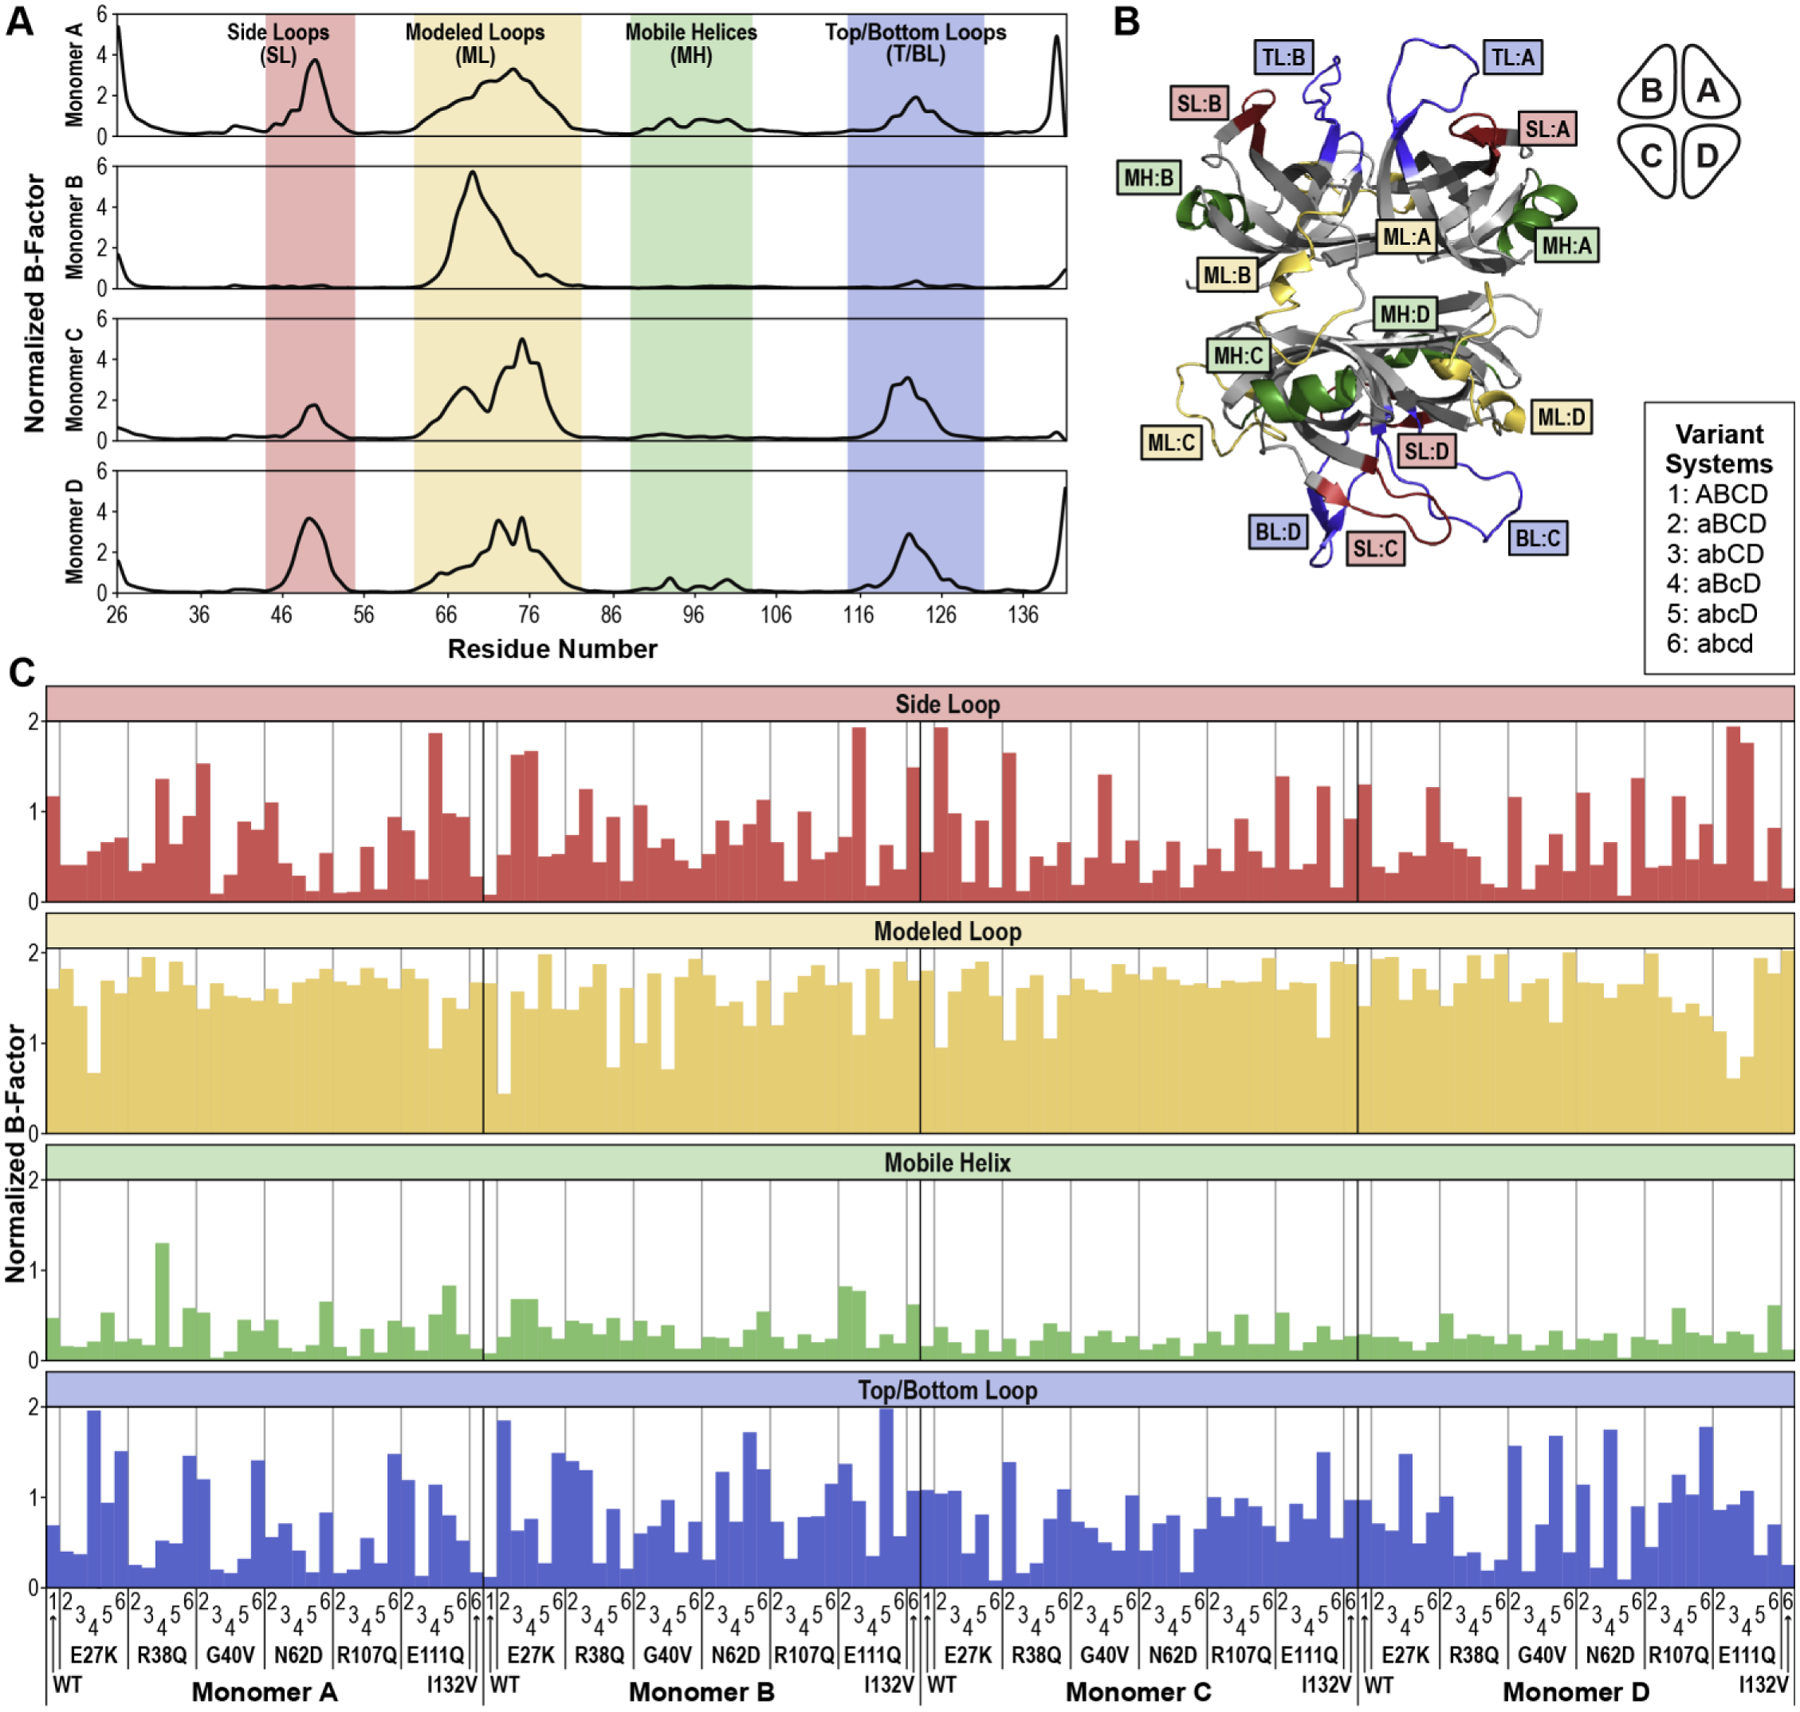
Figure 4. Normalized B-Factors.

(A) Normalized B-factors for each residue of each monomer in the WT SSBP1 tetramer are plotted, with flexible regions indicated (side loops, modeled loops, mobile helices, and top/bottom loops). (B) The flexible regions identified in A are labeled on a ribbon diagram snapshot from the WT tetramer simulation. (C) Normalized B-factors averaged over all residues in a given flexible region (loop or helix) are plotted for all tested systems.
