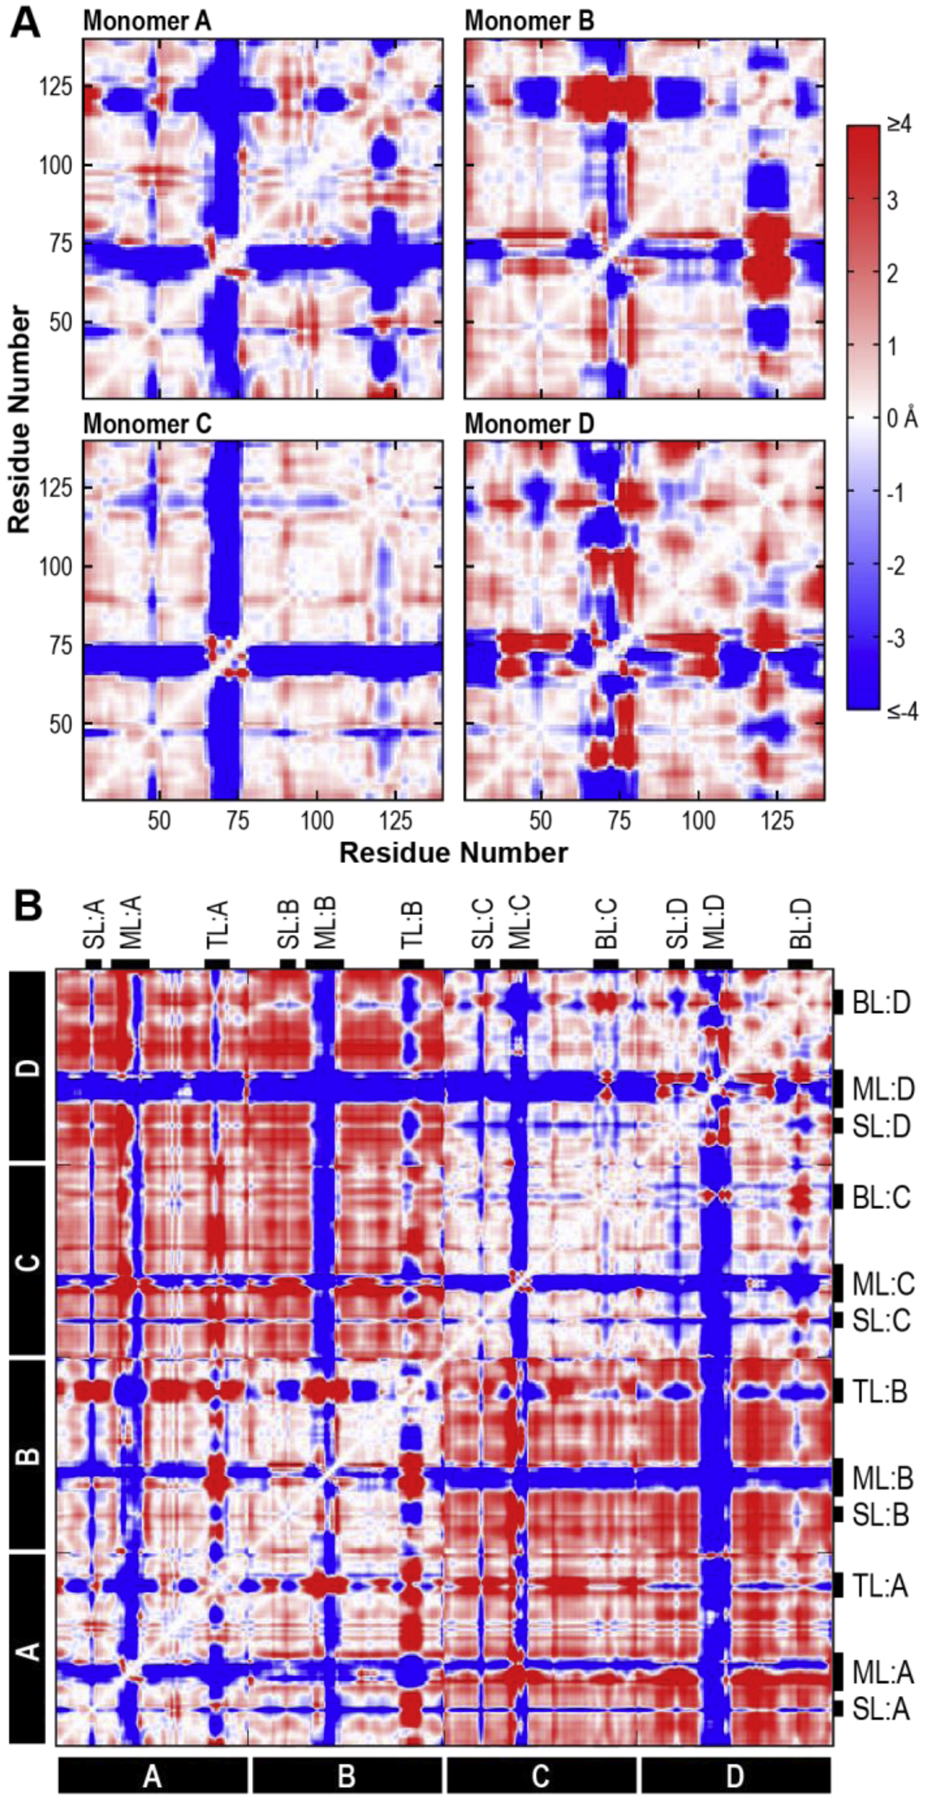
Figure 5. Cα Deviations of the WT SSBP1 System.

Average Cα deviations in the WT tetramer system were calculated from the final 100 ns of the WT simulation. (A) Cα deviations between residues within monomers A, B, C, and D of the WT system are plotted in heatmaps, where negative (blue) Cα deviations represent the residues moving closer over time, positive (red) Cα deviations indicate residues moving apart, and Cα deviations near zero (white) indicate no change relative to starting distances. (B) Cα deviations for every residue pair in the WT tetramer system are plotted with the same color scale as in A. Flexible features are marked with black tabs. SL, side loop; ML, modeled loop; TL, top loop; BL, bottom loop.
