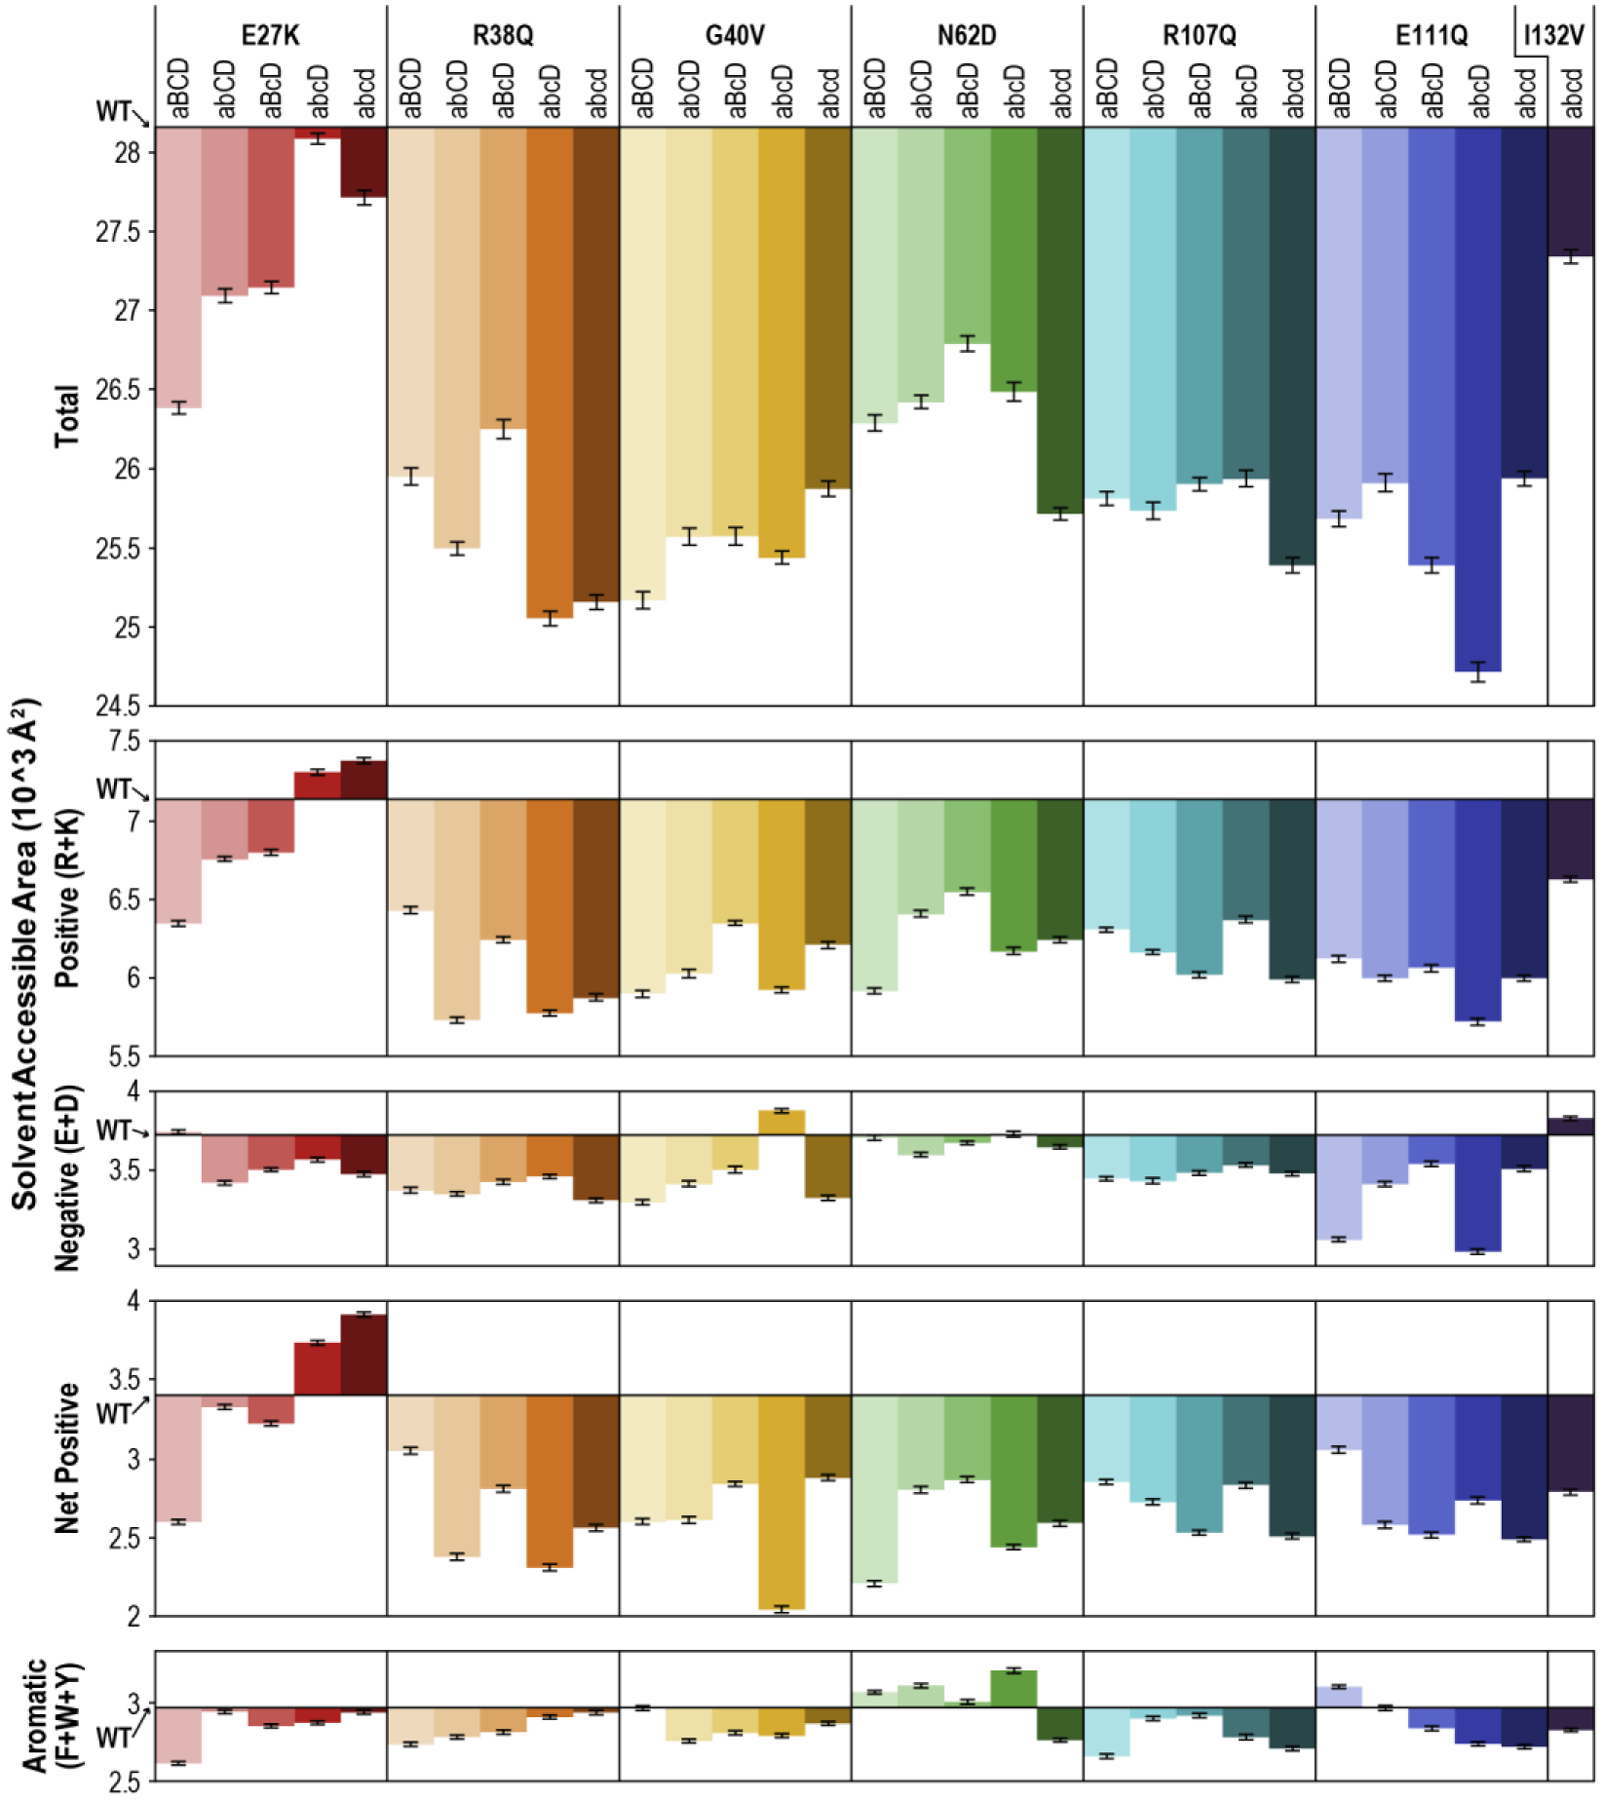
Figure 6. Solvent Accessible Area.

Total solvent accessible area (SAA), positive (basic) SAA, negative (acidic) SAA, net positive (net basic) SAA, and aromatic SAA were averaged over the final 100 ns of the simulation for each SSBP1 variant system. X-axes are set at the respective WT value for each plot. Positive SAA was calculated as the sum of SAA contributed by arginine (R) and lysine (K) residues, negative SAA as that contributed by aspartate (D) and glutamate (E) residues, and net positive SAA as the difference between positive and negative SAA. Aromatic SAA was calculated as the sum of SAA contributed by phenylalanine (F), tryptophan (W), and tyrosine (Y). Error bars represent standard error of the mean, propagated through subtracting WT from each variant value. WT SAA values (in 10^3 Å2) are as follows: Total, 28.16; Positive, 7.13; Negative, 3.72; Net Positive, 3.40; Aromatic, 2.97.
