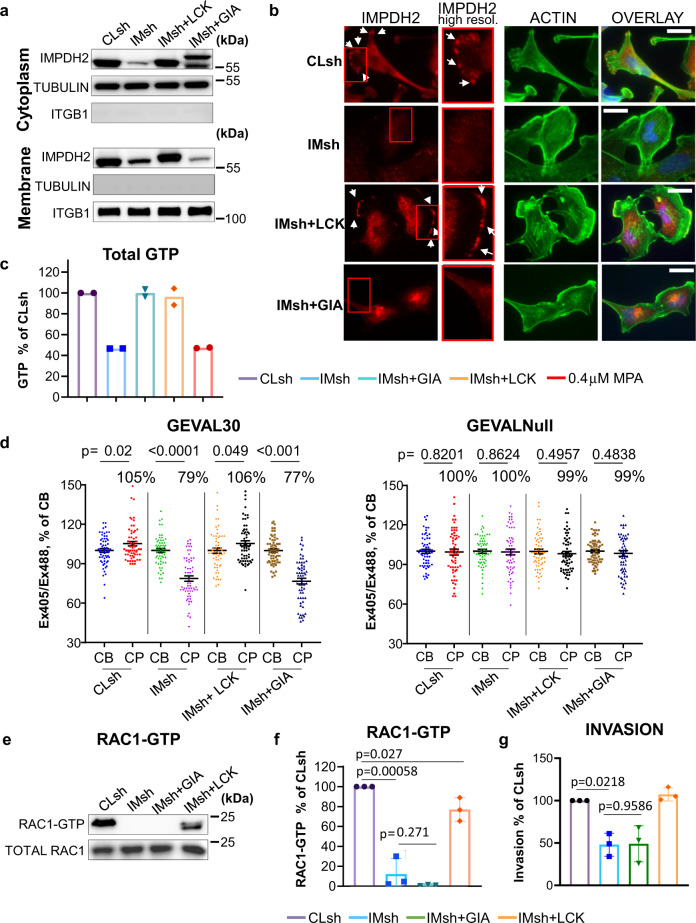
Fig. 2. Intracellular localization of IMPDH2 regulates GTP levels in cell protrusions, RAC1 activity, and cell invasion.
a Cells transduced with the indicated constructs (Cl sh control shRNA, IMsh IMPDH2 shRNA, IM-LCK IMPDH2 with LCK membrane-localization domain, IM-GIA IMPDH2 with giantin Golgi localization domain) were separated into the plasma membrane and cytoplasm fractions as described in Methods, followed by immunoblotting with the indicated antibodies Shown are representative images of at least two independent experiments. b Immunofluorescence analysis for IMPDH2 (red) and actin (phalloidin, green), and nuclei (Hoechst, blue) in MDA-MB-231 cells transduced with the indicated constructs. Arrows denote the presence of IMPDH2 at the cell plasma membrane. Scale bar 20 µm. Shown are representative images of two independent experiments. c GTP levels were determined via mass spectroscopy as described in Methods. The data represents average ± SEM of two independent experiments performed in duplicates. Statistics performed by two-tailed unpaired Student’s t-test (****p < 0.0001), exact p value <0.00001 for both cases. d Quantification of GEVAL activity in cell bodies (CB) and cell protrusions (CP) of MDA-MB-231 cells transduced with the indicated constructs and with GEVAL30 or GEVALNull (30 CBs and 30 CPs per cell type). Horizontal bars represent average. Individual values are from two experiments (15 CB and 15CP per experiment). Statistics were performed by a two-tailed unpaired Student’s t-test. e Cells transduced with the indicated constructs were probed in RAC1 activity assay as described in Methods. Shown are representative images of three independent experiments. f Quantification of (e). The data represents the average ± SEM of three independent experiments. Statistics were performed by a two-tailed unpaired Student’s t-test. g Invasion assay of MDA-MB-231 cells transduced with the indicated constructs. The data represents the average ± SEM of three independent experiments performed in duplicates. Statistics were performed by two-tailed unpaired Student’s t-test.

