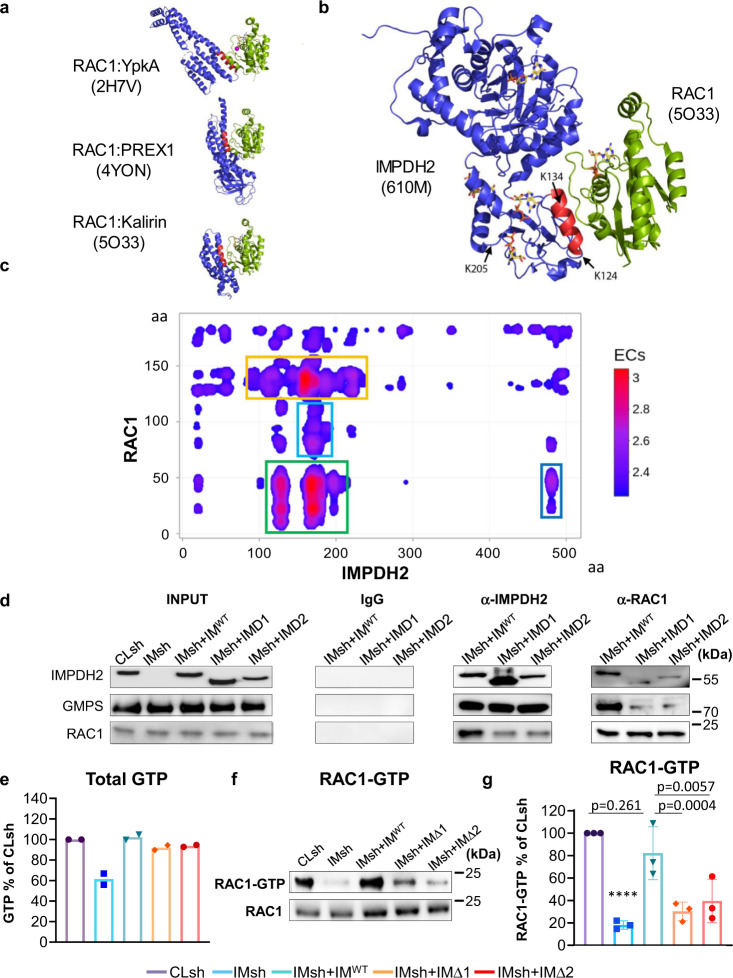
Fig. 5. Delineation of IMPDH2–RAC1 interactions.
a Structures of RAC1 (shown in green) in complex with other indicated proteins (shown in blue). The number in parenthesis indicates the corresponding entry in RCSB (Research Collaboratory for Structural Bioinformatics) Protein Data Bank. Note that RAC1 binds to α-helices (shown in red) in the target proteins. b A model of the IMPDH2–RAC1 interaction was created by superimposing the α-helix of IMPDH2 containing K134 (shown in red) onto the analogous helix in the RAC1-Kalirin complex. c Convolved evolutionary coupling of IMPDH2 and RAC1. Strength of the couplings between residues of the two proteins are color-coded with red color denoting the highest probability. Shown in colored frames are regions with a high (green), intermediate (yellow), and low (blue) probability of interactions. d Cells were transduced with control shRNA (Cl sh), IMPDH2 shRNA (IMsh), or IMPDH2 shRNA in combination with wild-type IMPDH2 (IMWT), IMPDH2 lacking 153-225 aa (IMΔ1), or IMPDH2 lacking 101-134 aa (IMΔ2). Cells were subjected to immunoprecipitation with the antibodies indicated on the top. The immunoprecipitated materials were probed in immunoblotting with the antibodies indicated on the left. Shown are representative images of at least two independent experiments. e GTP levels were determined via mass spectroscopy as described in Methods. The data represents the average ± SEM of two independent experiments performed in duplicates. Statistics performed by two-tailed unpaired Student’s t-test (****p < 0.0001), exact p value < 0.00001. The data represents the average ± SEM of two independent experiments performed in duplicates. f Cells transduced with the indicated constructs were probed in RAC1 activity assay as described in Methods. Shown are representative images of at three independent experiments. g Quantification of (f). The data represents the average ± SEM of three independent experiments. Statistics were performed by a two-tailed unpaired Student’s t-test.

