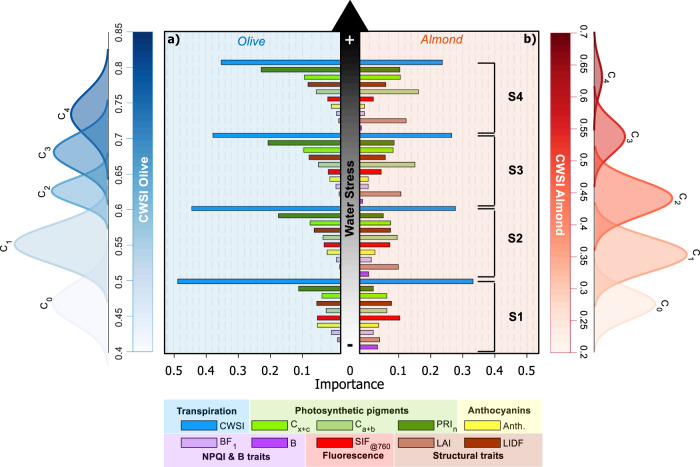
Fig. 3. Importance of spectral traits to detect abiotic-induced water stress symptoms.
Sensitivity of plant spectral traits calculated from hyperspectral and thermal imagery from trees under increasing abiotic stress (caused by decreasing water stress levels, from S1 to S4) across olive (a) and almond (b) trees. Analyses were carried out via clustering by comparing non-stressed trees (C0) vs. trees with rising CWSI levels (C1 to C4). Clustering was performed based on CWSI by following a modified three-sigma rule, where C0 consists of trees in the lowest 10th percentile. Clusters C1, C2, C3, and C4 were set to include only the trees with CWSI values above the 10th and below the 68th percentile (C1), between the 68th and 85th percentiles (C2), above the 85th and below the 95th percentile (C3), and above the 95th percentile (C4). For (a), the total number of trees was n = 488 (C0), n = 3,066 (C1), n = 1,090 (C2), n = 618 (C3) and n = 222 (C4). For b, the total number of trees was n = 390 (C0), n = 1,776 (C1), n = 1,248 (C2), n = 214 (C3) and n = 24 (C4). The importance of each predictor on the classification was assessed by the permutation of out-of-bag (OOB) predictor methodology applied as a random forest algorithm.

