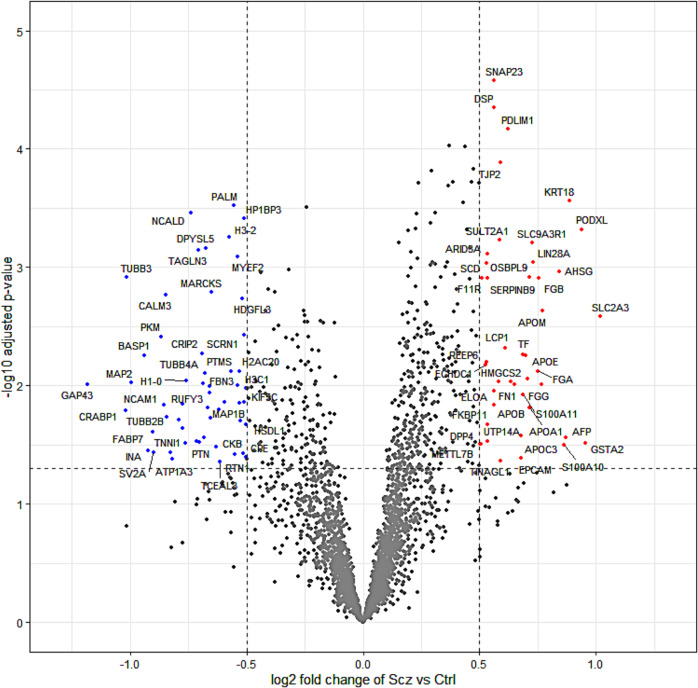
Fig. 2. Differential expression in the Scz cerebral organoid proteome.
Principal component analysis of the cerebral organoid proteome indicated data grouping based on phenotype, and protein expression distributions indicated data correlation across all samples. This statistical baseline allowed us to consider the differentially expressed proteins present in Scz patient-derived cerebral organoids, which are shown here as a volcano plot split by log2 fold change and –log10 adjusted p values. In sum, ~2.62% of 3705 proteins (peptide >1; intensity >0) identified exhibited differential expression. Significantly up-regulated proteins that surpassed log2 fold change thresholding are depicted to the right in red (p value <0.05, Log2FC > 0.05), whereas down-regulated proteins (p value < 0.05, Log2FC < -0.05) are presented to the left of the plot in blue. Notable Scz GWAS factors (see 108 loci identified in [33]) included the up-regulation of PODXL and down-regulation of PTN, which replicated our previous findings in a smaller cohort [1]. Note also the down-regulation of the neural stem cell proliferation factor CRABP1 [93] as well as canonical neuronal development markers (e.g. NCAM1 [94], NCALD [95], and CPE [78]), neuronal markers (e.g. MAP2, TUBB3, MAP1B), synaptic markers (e.g., SV2A). Conversely, a range of apolipoproteins (APOE, APOA1, APOB, APOC3) were found to be up-regulated in Scz patient-derived cerebral organoids.

