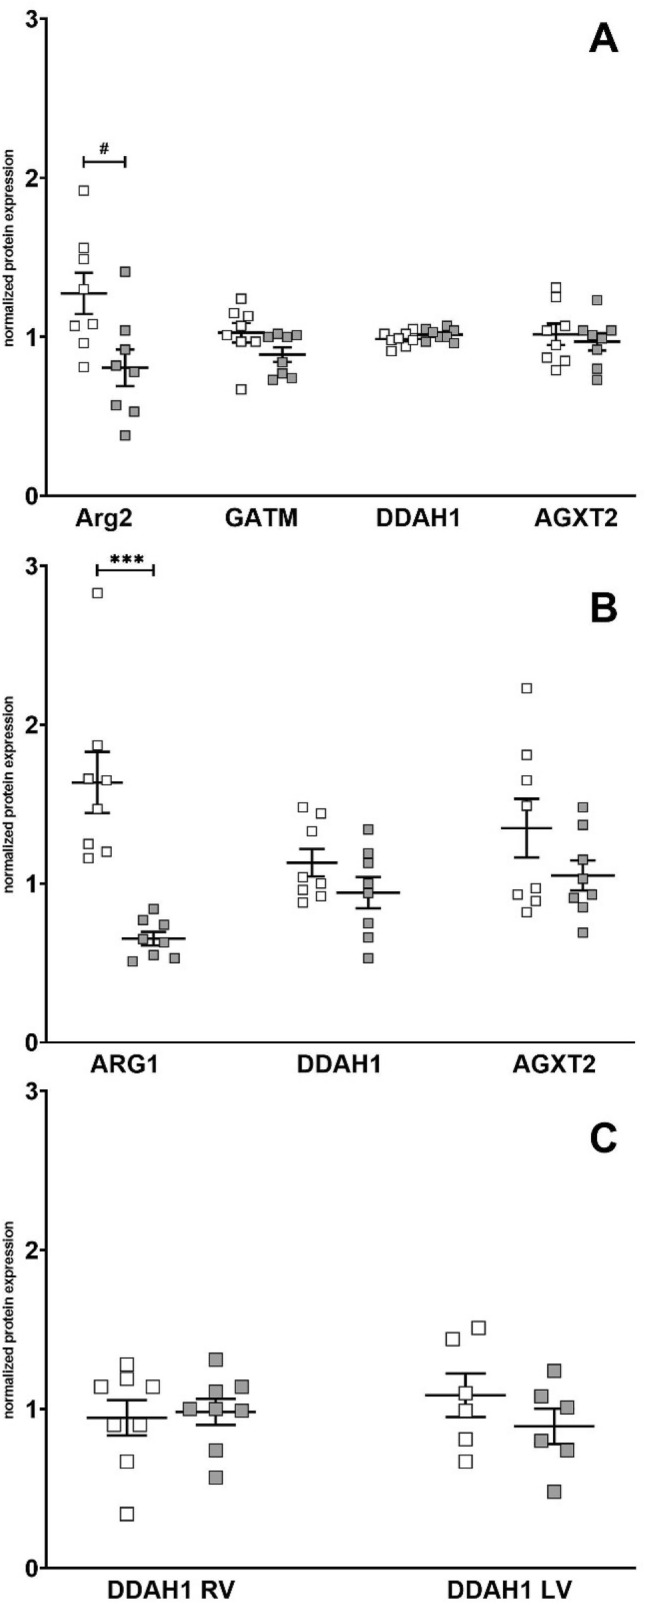
Figure 2.

Protein expression of key enzymes involved in arginine metabolism in kidney (A), liver (B) and heart (C) with measurements in right ventricle (RV) and left Ventricle (LV) in L-ZSF1 (white squares) and O-ZSF1 (grey squares). Y-axis shows arbitrary units that represent protein expression normalized to GAPDH (kidney/ heart) or alpha Tubulin (liver). Boxplots visualize the median, 25th and 75th percentiles and minimum/ maximum. P-values were calculated using Kruskal–Wallis test and were corrected for multiple testing using the Bonferroni-Dunn method. #p < 0.1, ***p < 0.001.
