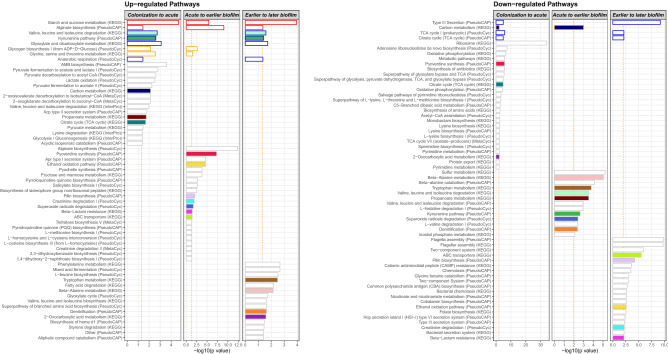
Figure 6.
Overview of pathway changes as colonized PAO1 progressed to biofilm wound infection. Between each transition—Colonization to acute infection (H24:H2H6), Acute infection to biofilm infection (D5:H24), and Earlier to later biofilm infection (D9:D5)—the pathways with over-represented up- or down-regulated genes are graphed vs. the p value of the overrepresentation of the genes into the pathways; the −log10 of the p value is graphed so more significant values are larger. Vertical dashed orange lines indicate p values < 0.05 or 0.01 for the up-and down-regulated pathways, respectively (so a similar number of pathways could be graphed since more pathways were enriched with down-regulated genes). Red-outlined bars indicate pathways changed in all comparisons. Blue-outlined bars indicate pathways changed between Colonization to acute infection and Earlier to later biofilm. Orange-outlined bars indicate pathways changed between Colonization to acute infection and Acute to earlier biofilm infection. Colored bars indicate pathways changed between any two comparisons.

