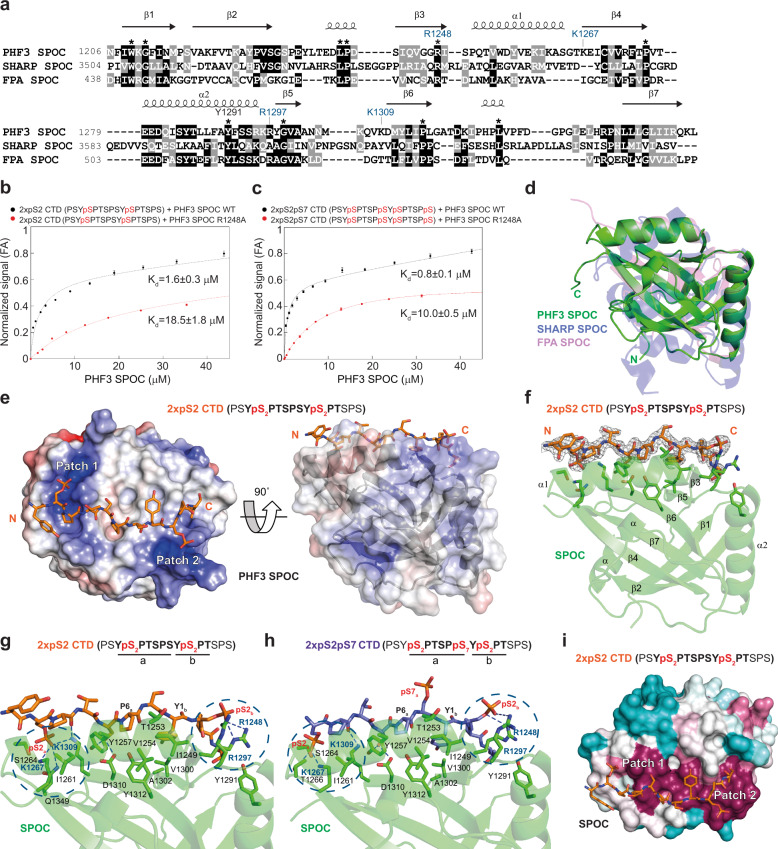
Fig. 2. PHF3 SPOC binds pS2 CTD peptides in vitro.
a Structure-based alignment of SPOC domains from PHF3 (6Q2V), SHARP (2RT5), and FPA (5KXF). Conserved residues are marked with an asterisk. b, c Fluorescence anisotropy (FA) measurement of the binding of b, 2xpS2 and c, 2xpS2pS7 FAM-labeled CTD peptides to PHF3 SPOC WT or R1248A mutant. Normalized fluorescence anisotropy is plotted as a function of protein concentration (n = 3). The data were normalized for visualization purposes and the experimental isotherms were fitted to one site saturation with non-specific binding model. d Overlay of SPOC structures from PHF3 (6Q2V), SHARP (2RT5) and FPA (5KXF) showed an average RMSD of 2.75 Å over 149 aligned Cα atoms between PHF3 and SHARP SPOC, and average RMSD of 1.94 Å over 123 aligned Cα atoms between PHF3 and FPA SPOC. e 2xpS2 CTD peptide binds two positively charged patches (Patch 1 and 2) on the surface of PHF3 SPOC. The color coded electrostatic surface potential of SPOC was drawn using the Adaptive Poisson-Boltzmann Solver package within PyMol. The electrostatic potential ranges from −5 (red) to +5 (blue) kT/e. The N- and C-termini of the peptide are indicated and always shown in the same orientation. f 2 Fo − Fc electron density map of pS2 peptide contoured at the 1.5σ level. CTD peptide sequences used for X-ray structures correspond to those used in binding assays. The residues of the CTD diheptapeptide that are visible in the structure are indicated in bold. CTD peptides used for X-ray structures had the same sequence as for the binding assays but were not fluorescently labeled. g, h Hydrogen bonding interactions between g, 2xpS2 and h, 2xpS2pS7 CTD peptides and PHF3 SPOC. SPOC monomer binds two phosphorylated S2 groups on the CTD peptides. SPOC residue labels from two positively charged patches are colored blue and the patches are contoured with dashed circles. i Evolutionary conservation of PHF3 SPOC residues projected onto the 2xpS2 co-structure using the ConSurf server. Residues are colored by their conservation grades with maroon showing the highest and turquoise the lowest degree of conservation. Two positively charged patches (Patch 1 and 2) are indicated.

