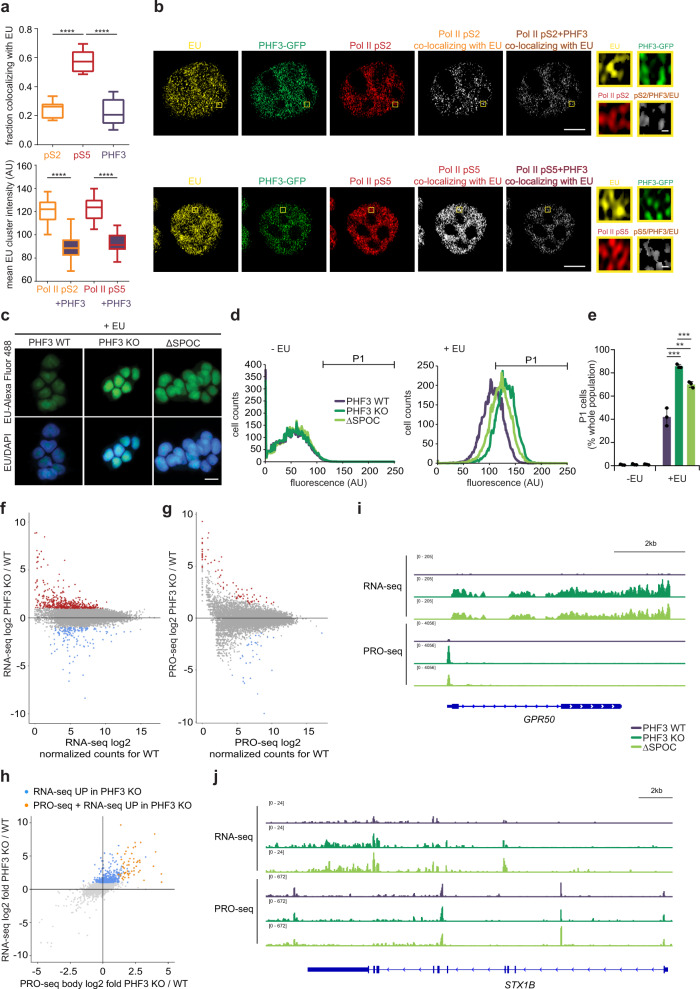
Fig. 4. PHF3 negatively regulates mRNA levels.
a High-resolution Airyscan imaging reveals a high degree of co-localization between Pol II pS5 and 5-EU whereas only a small fraction of Pol II pS2 or PHF3-GFP co-localizes with 5-EU (N = 21 for pS5; N = 15 for pS2; N = 23 for PHF3). The mean EU intensity is decreased in clusters where PHF3 and Pol II overlap compared to clusters containing only Pol II. Box and whiskers plots with error bars representing the 10 and 90 percentiles are shown. One-way ANOVA with Tukey’s multiple comparison test was performed to determine p-values (<0.0001). Each experiment was repeated twice with comparable results. Statistics are indicated in detail in Supplementary Data 7. b Representative Airyscan high resolution images of 5-EU (yellow), PHF3-GFP (green) and Pol II pS2 or pS5 (red) and clusters of Pol II that co-localize with EU or with both EU and PHF3 (white). Scale bar = 5 µm or 200 nm for zoomed regions. c–e PHF3 KO and ΔSPOC show increased incorporation of EU-Alexa Fluor 488 by c, fluorescence microscopy (scale bar = 10 µm) and d, e FACS analysis. d Cell counts for each fluorescence intensity in the absence (-EU) or presence of EU (+EU). e Percentage of cells belonging to the gated P1 fluorescent population shown in d. The following cell numbers were examined over three independent experiments: N = 29059 (WT –EU), N = 29918 (KO –EU), N = 29847 (ΔSPOC –EU), N = 29146 (WT +EU), N = 29649 (KO +EU), N = 29771 (ΔSPOC +EU). Data are presented as mean values ± standard deviation. One-tailed, two-sample equal variance t-test was used to determine p-values (Supplementary Data 7). f RNA-seq analysis shows upregulation of 620 genes (red dots, fold-change>2, p < 0.05) and downregulation of 173 genes (blue dots, fold-change>2, p < 0.05) in PHF3 KO compared to WT. Drosophila S2 cells were used for spike-in normalization. g PRO-seq analysis shows upregulation of 68 genes (red dots, fold-change>2, p < 0.05) and downregulation of 39 genes (blue dots, fold-change>2, p < 0.05) in PHF3 KO compared to WT. Drosophila S2 nuclei were used for spike-in normalization. Mean Pearson correlation coefficient between the samples was 0.96 (see Supplementary Fig. S10c). h Relationship between RNA-seq and PRO-seq fold change for PHF3 KO vs WT. Genes that are upregulated in PHF3 KO in RNA-seq but not PRO-seq are indicated in blue. Genes that are upregulated in both RNA-seq and PRO-seq are indicated in orange. i Integrative Genomics Viewer (IGV) snapshots showing RNA-seq and PRO-seq reads for GPR50 as a typical gene with increased RNA-seq and PRO-seq in PHF3 KO and ΔSPOC cells. j IGV snapshots showing RNA-seq and PRO-seq reads for STX1B as a typical gene with increased RNA-seq but no change in PRO-seq in PHF3 KO and ΔSPOC cells. RNA-seq was performed after Ribo-Zero treatment of total RNA.

