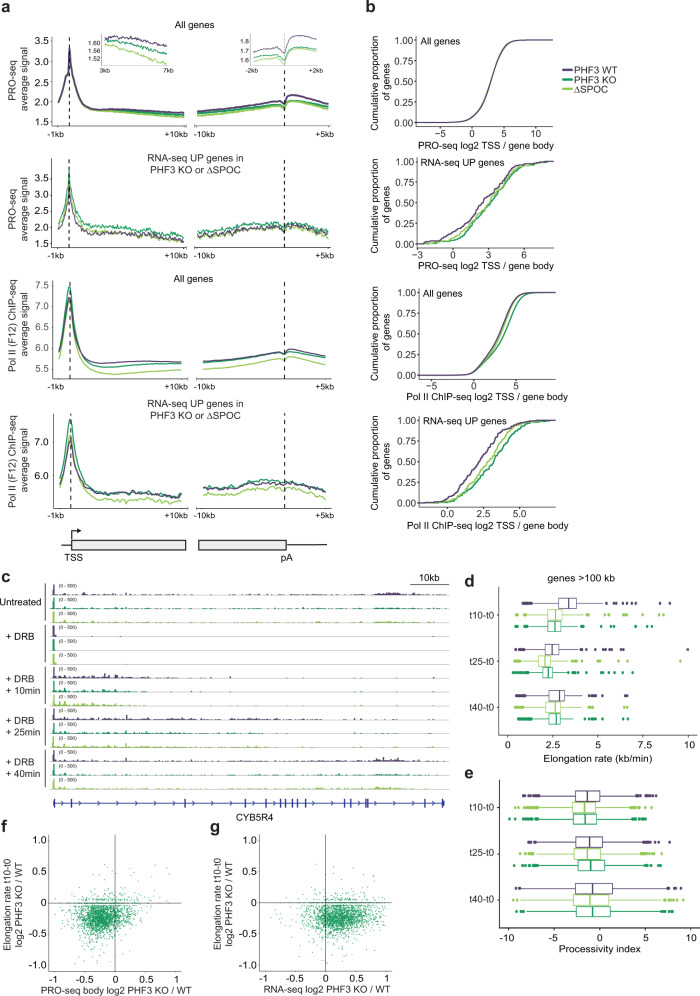
Fig. 5. PHF3 loss results in increased Pol II stalling and reduced elongation rate.
a Composite analysis of PRO-seq and Pol II (F-12) ChIP-seq distribution and signal strength in PHF3 WT, KO, and ΔSPOC on TSS-gene body region and gene body-pA region for all genes or RNA-seq upregulated genes (fold-change>2, p < 0.05). Mouse chromatin was used for spike-in normalization of ChIP-seq. b Stalling index analysis calculated as PRO-seq or Pol II ChIP-seq TSS/gene body signal for all genes or RNA-seq upregulated genes (fold-change>2, p < 0.05). c IGV snapshots showing PRO-seq reads for CYB5R4 for the elongation rate experiment. Pause release was blocked with the CDK9 inhibitor DRB for 3.5 h, followed by DRB washout to allow transcription for 10, 25, and 40 min. d Pol II elongation rate for genes >100 kb (N = 795) was calculated as the leading edge of waves of nascent transcription divided by the time after DRB washout. Data are presented as box and whiskers plots showing the median and the interquartile range. e Processivity index for genes >100 kb (N = 795) was calculated as log10 distal/proximal reads. Data are presented as box and whiskers plots showing the median and the interquartile range. f Relationship between PRO-seq body fold change and t10 elongation rate (10 min after DRB washout) fold change for PHF3 KO vs WT. g Relationship between RNA-seq fold change and t10 elongation rate (10 min after DRB washout) fold change for PHF3 KO vs WT.

