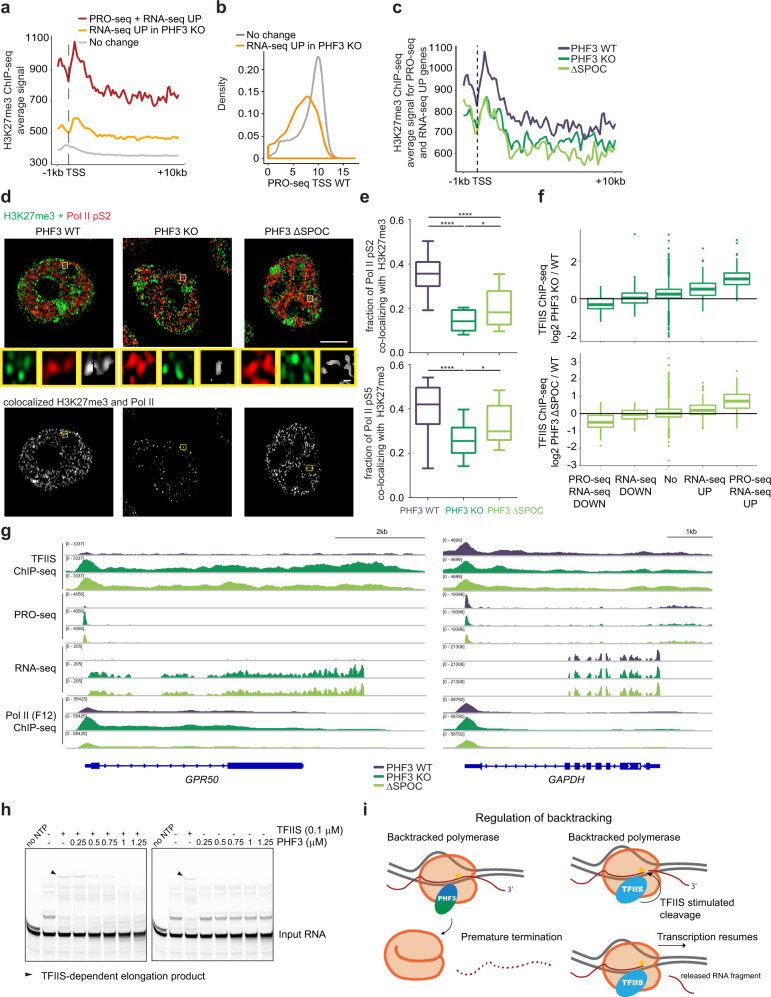
Fig. 7. PHF3 negatively regulates a small subset of genes by competing with TFIIS.
a Composite analysis of H3K27me3 distribution and signal strength in PHF3 WT cells on TSS-gene body region for different gene categories based on RNA-seq and PRO-seq data. b Genes upregulated in PHF3 KO cells according to RNA-seq (fold change>2) have low expression levels in WT cells as judged by nascent transcription (PRO-seq) levels at TSS. c Composite analysis of H3K27me3 distribution and signal strength in PHF3 WT, KO, and ΔSPOC cells on TSS-gene body region for genes upregulated in RNA-seq and PRO-seq in PHF3 KO or ΔSPOC cells (fold change>2). d Representative Airyscan high resolution images of Pol II pS2 (Alexa Fluor 594, red) and H3K27me3 (Alexa Fluor 488, green) in PHF3 WT, KO, or ΔSPOC cells. Co-localization analysis of clusters that overlap in both channels (white). Scale bar = 5 µm. e Quantification of the fraction of Pol II pS2 and Pol II pS5 co-localizing with H3K27me3 (pS2: N = 20 for WT; N = 14 for KO; N = 15 for ΔSPOC. pS5: N = 18 for WT; N = 22 for KO; N = 15 for ΔSPOC.). Box and whiskers plots with error bars representing the 10 and 90 percentiles are shown. One-way ANOVA with Tukey’s multiple comparison test was performed to determine p-values (****<0.0001; * = 0.04). Each experiment was repeated twice with comparable results. Statistics are indicated in detail in Supplementary Data 7. f TFIIS ChIP-seq log2 fold change PHF3 KO/WT (top) or PHF3 ΔSPOC/WT (bottom) for TSS. Genes were grouped according to changes in RNA-seq and PRO-seq: downregulation in RNA-seq (fold change>2; N = 128), upregulation in RNA-seq (fold change>2; N = 395), downregulation in RNA-seq and PRO-seq (fold change>2; N = 25), upregulation in RNA-seq and PRO-seq (fold change>2; N = 45) or no change (N = 15868). Statistics are indicated in detail in Supplementary Data 7. Mouse chromatin was used for spike-in normalization of TFIIS ChIP-seq. g IGV snapshots showing TFIIS ChIP-seq, PRO-seq, RNA-seq, and Pol II ChIP-seq (F-12) reads for GPR50 (left) and GAPDH (right) as a housekeeping gene. RNA-seq was performed after Ribo-Zero treatment of total RNA. h In vitro assay monitoring Pol II elongation on an arrest sequence in the presence of TFIIS and increasing amounts of PHF3 (left) or in the presence of PHF3 alone (right). Pol II-EC was formed using an excess of a DNA–RNA bubble scaffold containing 5′-FAM-labeled RNA. The short elongation product seen in the ‘no NTP’ lane is due to residual ATP from the phosphorylation reaction. The experiments were repeated three times and the representative gels are shown. i A model of PHF3-mediated regulation of backtracking through competition with TFIIS. PHF3 represses transcription by competing with TFIIS and impeding Pol II rescue from backtracking, which may result in premature termination.

