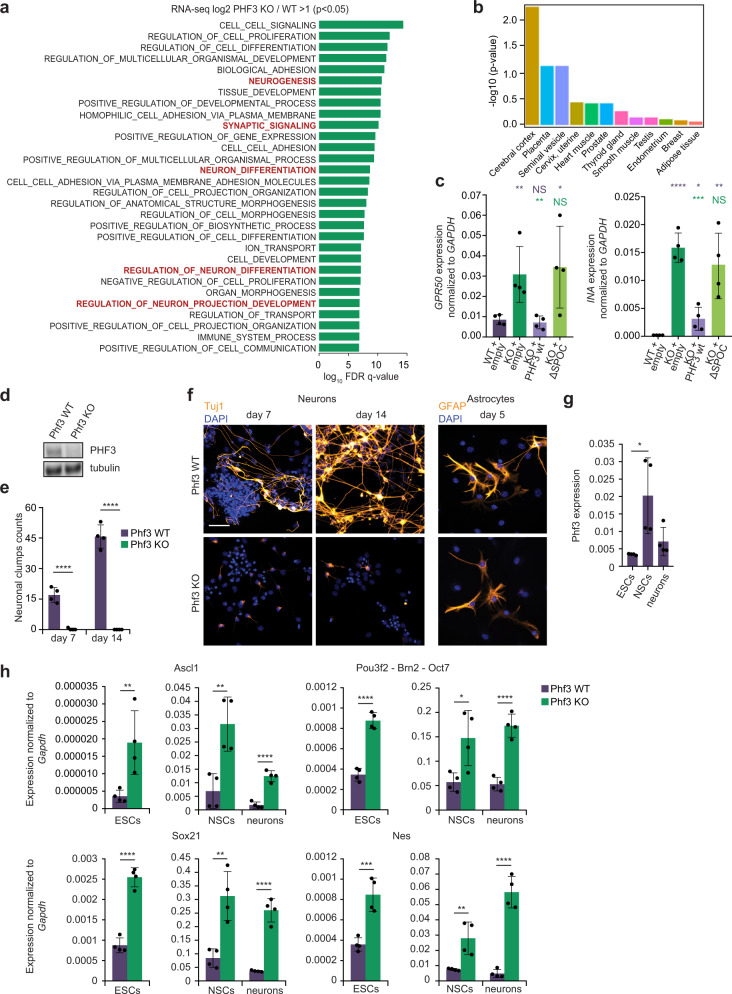
Fig. 8. PHF3 regulates neuronal gene expression and neuronal differentiation of mouse embryonic stem cells (mESCs).
a GO analysis of genes upregulated in PHF3 KO HEK293T cells according to RNA-seq shows enrichment of genes involved in neurogenesis. GSEA Biological processes tool was used. b TissueEnrich analysis shows the enrichment of cerebral cortex among transcriptionally upregulated genes in PHF3 KO. TissueEnrich analyses the enrichment of a particular gene set in the tissue specific expression profiles provided by the GTEx transcriptional compendium (https://www.gtexportal.org/home/faq#citePortal). The y-axis shows the -log10 of Benjamini–Hochberg corrected p-value. c RT-qPCR analysis of INA and GPR50 mRNA levels in PHF3 WT and PHF3 KO HEK293T cells with stable integration of mCherry empty vector, and KO-complemented cell lines stably expressing mCherry-PHF3 wild-type or ΔSPOC. Four biologically independent experiments were performed. Data are presented as mean values ± standard deviation. The bars represent average expression from different clones as biological replicates. A t-test was performed by comparing expression levels with WT (violet asterisk) and KO (green asterisk). d CRISPR/Cas9 Phf3 knock-out in mESCs shows complete loss of protein by Western blotting. The experiment was performed once. e Quantification of beta III tubulin (TuJ1)-positive neuronal clump formation in Phf3 WT and KO cells after 7 or 14 days of neuronal differentiation. Neuronal clumps represent agglomerates of cells connected with Tuj1-positive cell projections. Four biologically independent experiments were performed. Data are presented as mean values ± standard deviation. f Representative immunofluorescence images of TuJ1-stained neurons and glial fibrillary acidic protein (GFAP)-stained astrocytes. Scale bar = 40 μm. The experiment was performed four times. g Phf3 expression levels in embryonic stem cells (ESCs), neural stem cells (NSCs) and neurons determined by RT-qPCR. Four biologically independent experiments were performed. Data are presented as mean values ± standard deviation. h Comparison of expression levels of different neuronal markers between Phf3 WT and KO ESCs, NSCs, and neurons by RT-qPCR. Four biologically independent experiments were performed. Data are presented as mean values ± standard deviation. One-tailed, two-sample equal variance t-test was used to determine p-values in c, e, g, h. P-values are indicated in Supplementary Data 7.

