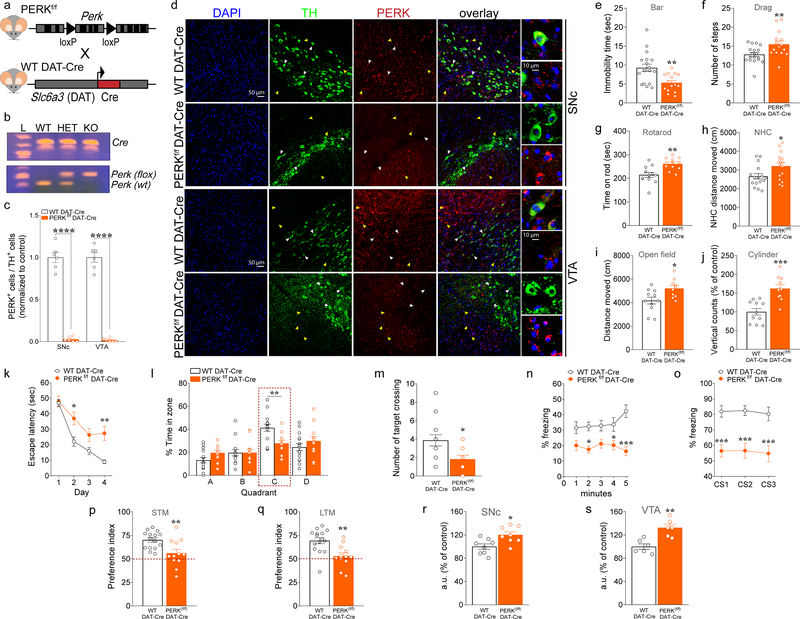
Figure 1. Deletion of PERK from DA neurons induces motor facilitation, but results in multiple cognitive phenotypes and dysregulated de novo translation in mice.
(a) Schematic representation of DAT-neuron specific deletion of PERK in PERKf/f mice crossed with WT DAT-Cre mice. (b) PCR identification of alleles of PerkloxP and DAT-driven Cre. (c) Summary plot showing the ratio of TH+ cells in both the SNc and the VTA that co-labeled for PERK in PERKf/f DAT-Cre vs. WT DAT-Cre control mice (n = 6 mice each, unpaired t test, SNc: t(10)= 15.85, P <0.0001; VTA: t(10)= 16.86, P <0.0001) after treatment with thapsigargin. (d) Immunofluorescent detection of TH+ (green) neurons and PERK (red) expression in SNc and VTA DA neurons of PERKf/f DAT-Cre and WT DAT-Cre mice, confirming positive targeting of dopaminergic (TH+) neurons for the deletion of PERK (scale bars represent 50 μm). White arrows indicate dopaminergic neurons (green) and PERK (red) co-staining; yellow arrows indicate non-dopaminergic neurons and PERK (red) staining. PERKf/f DAT-Cre and their WT DAT-Cre littermates mice were subjected to a set of tests, including the bar (e), drag (f), rotarod (g), novel home cage (h), and open field (i,j) tests to investigate locomotor activity, at 3 months of age. (e) Summary plot of immobility time (sec) during bar test in PERKf/f DAT-Cre versus WT DAT-Cre mice (unpaired t test, t(31)= 3.33, P <0.01). (f) Summary plot of average number of steps during drag test (unpaired t test, t(31)= 2.75, P <0.01). (g) Summary plot of latency to fall from the rotating rod measured as average of two days (4 trials/day) test (unpaired t test, t(22)= 3.69, P <0.01). (h) Summary plot of the novelty-induced locomotor activity expressed as a novel home cage (NHC) distance moved (cm) in the first 10 minutes interval of a 60 minutes test during novel home cage test (unpaired t test, t(29)= 2.31, P <0.05). (i,j) Summary plot of (i) spontaneous locomotor activity expressed as distance moved (cm) and (j) vertical activity (number of counts) during the open field test over 15 min (unpaired t test, i, t(19)= 2.68, P <0.05; j, t(19)= 4.56, P <0.001 ).
(k-m) Summary plots of (k) average latency to find the hidden platform during a 4-day training protocol, (l) percentage time spent in each zone, and (o) average number of times crossing the location of the previously hidden platform during probe test in 3- month old PERKf/f DAT-Cre versus WT DAT-Cre mice in the MWM test (k, two-way RM ANOVA, followed by Bonferroni’s multiple comparisons test, time x genotype, F(3, 75) = 3.53, P < 0.05; l, two-way RM ANOVA, followed by Bonferroni’s multiple comparisons test, quadrant x genotype, F(3, 75) = 3.77, P < 0.05; m, unpaired t test, t(25) = 2.607, P = 0.02). (n,o) Summary plots of average percentage of freezing during (n) exposure to the context 24 hours after training, and (o) exposure to 3 CS presentations in a novel context in the associative threat memory test in 3-month old PERKf/f DAT-Cre versus WT DAT-Cre mice (n, two-way RM ANOVA, followed by Bonferroni’s multiple comparisons test, genotype, F(1, 25) = 20.45, P = 0.0001; o, two-way RM ANOVA, followed by Bonferroni’s multiple comparisons test, genotype, F(1, 25) = 28.53 P <0.0001). (p,q) Summary plots of preference indices of mice towards a novel object introduced in the novel object recognition test in 3-month old PERKf/f DAT-Cre versus WT DAT-Cre mice (unpaired t test; p, t(25) = 3.079, P < 0.01; q, t(25) = 3.433, P < 0.01;). Mice were analyzed using Student’s t test or two-way RM ANOVA, followed by Bonferroni’s test for multiple comparisons. *P < 0.05, **P < 0.01, ***P < 0.001 different from age-matched littermates. All data are shown as mean ± s.e.m. of n = 15–18 mice/genotype (e,f); n = 12 mice/genotype (g); n = 15–16 mice/genotype (h); n = 10–11 mice/genotype (i,j); n = 12–15 mice/genotype (k-q). All data are shown as mean ± s.e.m. *P < 0.05, **P < 0.01 and ***P < 0.001 PERKf/f DAT-Cre versus WT DAT-Cre mice. (r,s) Quantification of increased AHA-alkyne-Alexa 647 signal in fluorescent arbitrary units (a.u.) expressed as % of control in TH+ neurons (Green) from SNc (r) and VTA (s) of PERKf/f DAT-Cre vs. WT DAT-Cre mice. Cell soma intensity was measured in ImageJ. Statistical significance was determined by using Student’s t test (PERKf/f DAT-Cre vs. WT DAT-Cre mice; unpaired t test; r, t(14) = 2.933, P = 0.011; s, t(10) = 4.215, P = 0.002). Data are shown as mean ± s.e.m. of n = 6/8 mice per group (average of n = 40 somas per slice, n = 2 slices per mouse, from three independent experiments) *P < 0.05, **P < 0.01.

