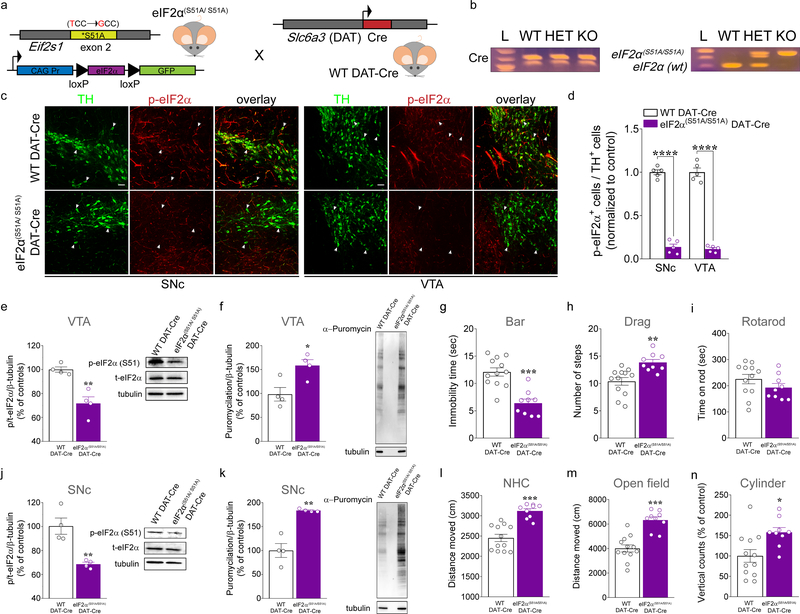
Figure 2. eIF2α(S51A/S51A) DAT-Cre mice display enhanced locomotor activity.
(a) Schematic representation of DAT-neuron specific expression of phospho-mutant eIF2α in eIF2α(S51A/S51A) mice crossed with WT DAT-Cre mice. (b) PCR identification of alleles of eIF2α(S51A/S51A) and DAT-driven Cre. (c) Immunofluorescent detection of TH+ (green) neurons and phospho-eIF2α (p-eIF2α; red) expression in SNc and VTA DA neurons of eIF2α(S51A/S51A) DAT-Cre and WT DAT-Cre mice, confirming positive targeting of dopaminergic (TH+) neurons for the expression of phospho-mutant eIF2α (scale bars represent 50 μm). Arrows indicate dopaminergic neurons (green) and p-eIF2α (red) co-stain. (d) Summary data showing the ratio of TH+ cells in both the SNc and the VTA that co-labeled for p-eIF2α in eIF2α(S51A/S51A) DAT-Cre vs. WT DAT-Cre control mice (n = 5 mice each, unpaired t test, SNc: t(8)= 19.61, P <0,0001; VTA: t(8)= 17.19, P <0,0001).
(e,j) Representative western blots (right panel) and quantification of phosphorylation of eIF2α in VTA (e) and SNc (j) of eIF2α(S51A/S51A) DAT-Cre and WT DAT-Cre mice. Summary plot showed a robust decrease in the phosphorylation of eIF2α in both VTA (e; unpaired t test, t(6) = 4.79, P = 0.003; n= 4 independent lysates from 4 mice per group) and SNc (j; unpaired t test, t(6) = 4.54, P = 0.004; n= 4 independent lysates from 4 mice per group) of eIF2α(S51A/S51A) DAT-Cre mice compared with controls. (f,k) Representative western blots (right panel) and quantification of newly synthesized brain proteins in VTA (f) and SNc (k) of eIF2α(S51A/S51A) DAT-Cre and WT DAT-Cre mice, labelled with puromycin using the SUnSET method (see Methods). Summary plot of puromycilation indicated increased de novo translation in both VTA (f; unpaired t test, t(6) = 3.18, P = 0.019; n= 4 independent lysates from 4 mice per group) and SNc (k; unpaired t test, t(6) = 5.72, P = 0.0012; n= 4 independent lysates from 4 mice per group) of eIF2α(S51A/S51A) DAT-Cre mice compared with controls. 3-month old eIF2α(S51A/S51A) DAT-Cre mice and their WT DAT-Cre littermates mice were subjected to a set of tests including the bar (g), drag (h), rotarod (i), novel home cage, (l) and open field (m,n) tests to investigate locomotor activity. (g) Summary plot of immobility time (sec) during bar test in eIF2α(S51A/S51A) DAT-Cre versus WT DAT-Cre mice (unpaired t test, t(19) = 5.21, P < 0.001). (h) Summary plot of average number of steps during drag test (unpaired t test, t(19) = 3.67, P < 0.01). (i) Summary plot of latency to fall from the rotating rod measured as average of two days (4 trials/day) test (unpaired t test, t(19) = 1.30, P = 0.20). (l) Summary plot of the novelty-induced locomotor activity expressed as a distance moved (cm) in the first 10 minutes interval of a 60 minutes test during novel home cage test (unpaired t test, t(19) = 5.76, P < 0.001). (m,n) Summary plot of (m) spontaneous locomotor activity expressed as distance moved (cm) and (n) vertical activity (number of counts) during the open field test (unpaired t test; m, t(19) = 2.78 P < 0.001; n, t(19) = 5.71 P = 0.012). All data are shown as mean ± s.e.m. of n = 9 eIF2α(S51A/S51A) DAT-Cre mice and n = 12 WT DAT-Cre mice. *P < 0.05, **P < 0.01 and ***P < 0.001 eIF2α(S51A/S51A) DAT-Cre versus WT DAT-Cre mice.

