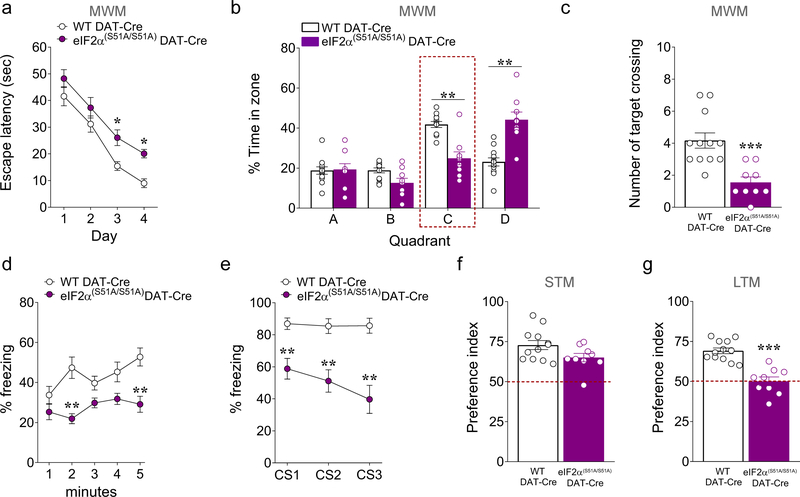
Figure 3. eIF2α(S51A/S51A) DAT-Cre mice display multiple cognitive phenotypes.
(a-c) Summary plots of (a) average latency to find the hidden platform during a 4-day training protocol, (b) percentage spent in each zone and (c) average number of times spent crossing the location of the previously hidden platform during probe tests in 3- month old eIF2α(S51A/S51A) DAT-Cre versus WT DAT-Cre mice in the MWM test (a, two-way RM ANOVA, followed by Bonferroni’s multiple comparisons test, time F(3, 57) = 67.07, P < 0.001, genotype F(1, 19) = 9.49, P < 0.01; b, two-way RM ANOVA, followed by Bonferroni’s multiple comparisons test, quadrant x genotype, F(3, 57) = 17.65, P < 0.001; c, unpaired t test, t(19) = 4.193, P < 0.001). (d,e) Summary plots of average percentage of freezing during (d) exposure to the context 24 hours after training, and (e) exposure to 3 CS presentations in a novel context in the associative threat memory test in 3-month old eIF2α(S51A/S51A) DAT-Cre versus WT DAT-Cre mice (d, two-way RM ANOVA, followed by Bonferroni’s multiple comparisons test, genotype, F(1, 19) = 18.69, P < 0.001; e, two-way RM ANOVA, followed by Bonferroni’s multiple comparisons test, genotype, F(1, 19) = 26.76 P <0.001). (f,g) Summary plots of preference indices of mice towards a novel object introduced in the novel object recognition test in 3-month old eIF2α(S51A/S51A) DAT-Cre versus WT DAT-Cre mice (unpaired t test; f, t(19)= 1.967, P = 0.06; g, t(19) = 6.017, P < 0.001). All data are shown as mean ± s.e.m. of n = 9 eIF2α(S51A/S51A) DAT-Cre mice and n = 12 WT DAT-Cre mice. *P < 0.05, **P < 0.01 and ***P < 0.001 eIF2α(S51A/S51A) DAT-Cre versus WT DAT-Cre mice.

