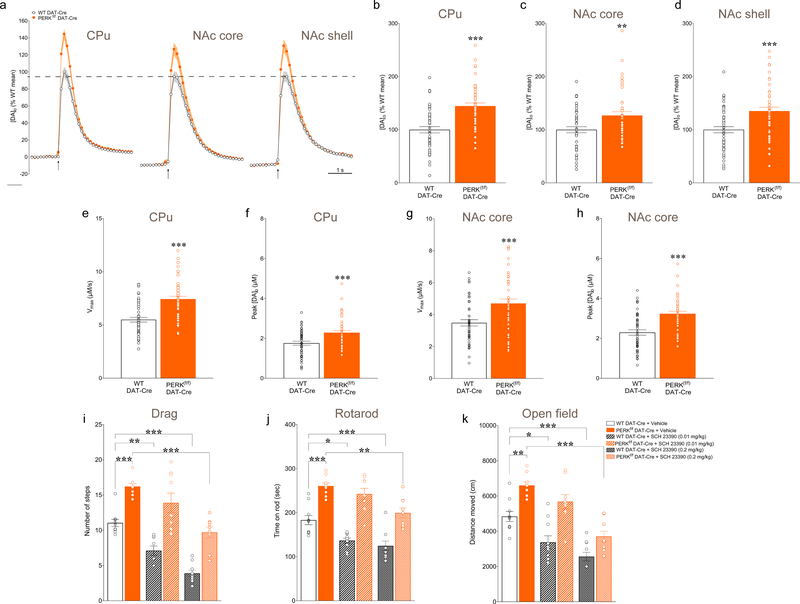
Figure 4. Deletion of PERK in DA neurons alters striatal DA release and DAT activity in mice.
(a) Average single-pulse (1p) evoked [DA]o transients recorded in CPu, NAc core, and NAc shell in PERKf/f DAT-Cre versus control DAT-Cre mice at 3 months of age. (b-d) Summary plot of evoked [DA]o peak expressed as % mean control in CPu (unpaired t-test, t(98) = 5.345, P < 0.001), NAc core (unpaired t-test, t(91) = 2.954, P < 0.01), and NAc shell (unpaired t-test, t(97) = 3.807, P < 0.001) in 3-month old mice. Vmax values (maximum uptake velocity; e,g) and Cpeak values (peak concentration; f,h) for DAT-mediated DA uptake derived from Michaelis-Menten analysis of single pulse evoked [DA]o records determined using a fixed Km of 0.9 μM for each brain region and genotype. (e) Summary plot of Vmax values in CPu of WT DAT-Cre versus PERKf/f DAT-Cre mice (unpaired t-test, t(94) = 5.589, P < 0.001). (f) Summary plot of Cpeak values in CPu of WT DAT-Cre versus PERKf/f DAT-Cre mice (unpaired t-test, t(94) = 5.113, P < 0.001). (g) Summary plot of Vmax values in NAc core of WT DAT versus PERKf/f DAT-Cre mice (unpaired t-test, t(90) = 3.616, P < 0.001). (h) Summary plot of Cpeak values in NAc core of WT DAT versus PERKf/f DAT-Cre mice (unpaired t-test, t(90) = 3.554, P < 0.001). Data are means ± s.e.m. of n mice, where n denotes the number of recording sites sampled from 3 to 5 mice per genotype; **P < 0.01; ***P < 0.001 for WT DAT-Cre vs. PERKf/f DAT-Cre mice. Values with R2 < 0.95, indicating goodness-of-fit were excluded from the data reported here. (i-k) In vivo pharmacological targeting of DA machinery reveals the impact of PERK deletion in DA neurons in mice. Acute i.p. injection of the D1 receptor antagonist (SCH 23390; 0.01 mg/kg) affects locomotor activity phenotype in WT DAT-Cre mice, but does not alter locomotor activity of PERKf/f DAT-Cre mice. Conversely, high-dose SCH 23390 (0.2 mg/kg) impairs locomotor activity in both genotypes. (i) Summary plot of average number of steps during drag test (two-way ANOVA, genotype F(1, 51) = 93.91, P<0.0001, treatment F (2, 51) = 41.83, P<0.0001). (j) Summary plot of latency to fall from the rotating rod measured as average of two days (4 trials/day) test (two-way ANOVA, genotype F(1, 51) = 112.8, P<0.0001, treatment F(2, 51) = 18.19, P<0.0001). (k) Summary plot of spontaneous locomotor activity expressed as distance moved (cm) during the open field test (two-way ANOVA, genotype; F(1, 51)= 46.80, P<0.0001, treatment F(2, 51) = 34.66, P<0.0001). Mice were analyzed using two-way ANOVA followed by the Bonferroni’s test for multiple comparisons. *P < 0.05, **P < 0.01, ***P < 0.001. All data are shown as mean ± s.e.m. of n =10 (WT DAT-Cre) or 9 (PERKf/f DAT-Cre) mice/treatment.

