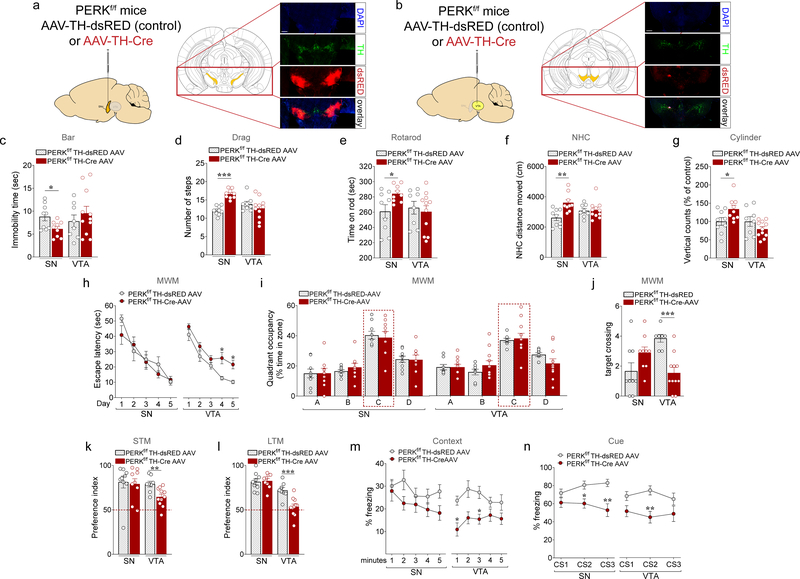
Figure 5. Selective virogenetic deletion of PERK in DA neurons of the SNc or the VTA results in motor or cognitive phenotypes, respectively similar to those displayed by the PERKf/f DAT-Cre mice.
(a,b) Schematic for experiments shown in c-n. Either AAV2/10 TH-dsRED (control) or AAV2/10 TH-iCre (AAV-TH Cre) was injected bilaterally into (a) the SNc or (b) the VTA of PERKf/f mice. Representative low magnification immunofluorescence images showing the injection sites (scale bar represents 500 μm). (c-g) PERKf/f TH-Cre-AAV and PERKf/f TH-dsRED AAV control mice were subjected to a set of tests including the bar (c), drag (d), rotarod (e), novel home cage (f), and open field (g) tests to investigate locomotor activity at 3 months of age. (c) Summary plot of immobility time (sec) during bar test in PERKf/f TH-Cre-AAV vs. PERKf/f TH-dsRED AAV control mice (unpaired t test, SN: t(16) = 2.500, P < 0.05; VTA: n.s). (d) Summary plot of average number of steps during drag test (unpaired t test, SN: t(16) = 7.660, P < 0.001; VTA: n.s.). (e) Summary plot of latency to fall from the rotating rod measured as average of two days (4 trials/day) test (unpaired t test, SN: t(16) = 2.439, P < 0.05; VTA: n.s.). (f) Summary plot of the novelty-induced locomotor activity expressed as a distance moved (cm) in the first 10 minutes interval of a 60 minutes test during novel home cage test (unpaired t test, SN: t(16) = 3.586, P < 0.01; VTA: n.s.). (g) Summary plot of vertical activity (number of counts as % of control) during the open field test (unpaired t test; SN: t(16) = 2.300, P < 0.05; VTA: n.s.).. (h-j) Summary plots of (h) average latency to find the hidden platform during a 5 training protocol, (i) percentage of total time spent in each quadrant, and (j) average number of times spent crossing the location of the previously hidden platform during probe tests in 3-month old PERKf/f TH-Cre-AAV versus PERKf/f TH-dsRED AAV control mice injected in either SN or VTA in the MWM test (h, two-way RM ANOVA, followed by Bonferroni’s multiple comparisons test, SN: n.s; VTA: genoype, F(1, 17) = 15.22, P < 0.01; i, two-way RM ANOVA, followed by Bonferroni’s multiple comparisons test, quadrant x genotype, n.s., in both SN and VTA; j, unpaired t test, SN: n.s.; VTA: t(17) = 4.927, P < 0.001). (k,l) Summary plots of preference indices of mice toward a novel object introduced in the novel object recognition test in PERKf/f TH-Cre-AAV versus PERKf/f TH-dsRED AAV control mice injected in either SN or VTA (unpaired t test; k, SN: n.s., VTA: t(17) = 3.173, P < 0.01; l, SN: n.s., VTA: t(17) = 4.102, P < 0.001). (m,n) Summary plots of average percentage of freezing during (m) exposure to the context 24 hours after training, and (n) exposure to 3 CS presentations in a novel context in the associative threat memory test in PERKf/f TH-Cre-AAV versus PERKf/f TH-dsRED AAV control mice injected in either SN or VTA (m, two-way RM ANOVA, followed by Bonferroni’s multiple comparisons test, genotype, SN: n.s., VTA: genotype, F(1, 17) = 10.97, P < 0.01; n, two-way RM ANOVA, followed by Bonferroni’s multiple comparisons test, SN: time x genotype, F(2, 32) = 5.837 P <0.01, VTA: time x genotype, F(2, 34) = 2.79 P =0.075). All data are shown as mean ± s.e.m. of n = 9 PERKf/f TH-Cre-AAV and PERKf/f TH-dsRED AAV mice injected in the SN; n = 11 PERKf/f TH-Cre-AAV mice and n = 8 PERKf/f TH-dsRED AAV mice injected in the VTA. *P < 0.05, **P < 0.01 and ***P < 0.001 PERKf/f TH-Cre-AAV versus PERKf/f TH-dsRED AAV mice.

