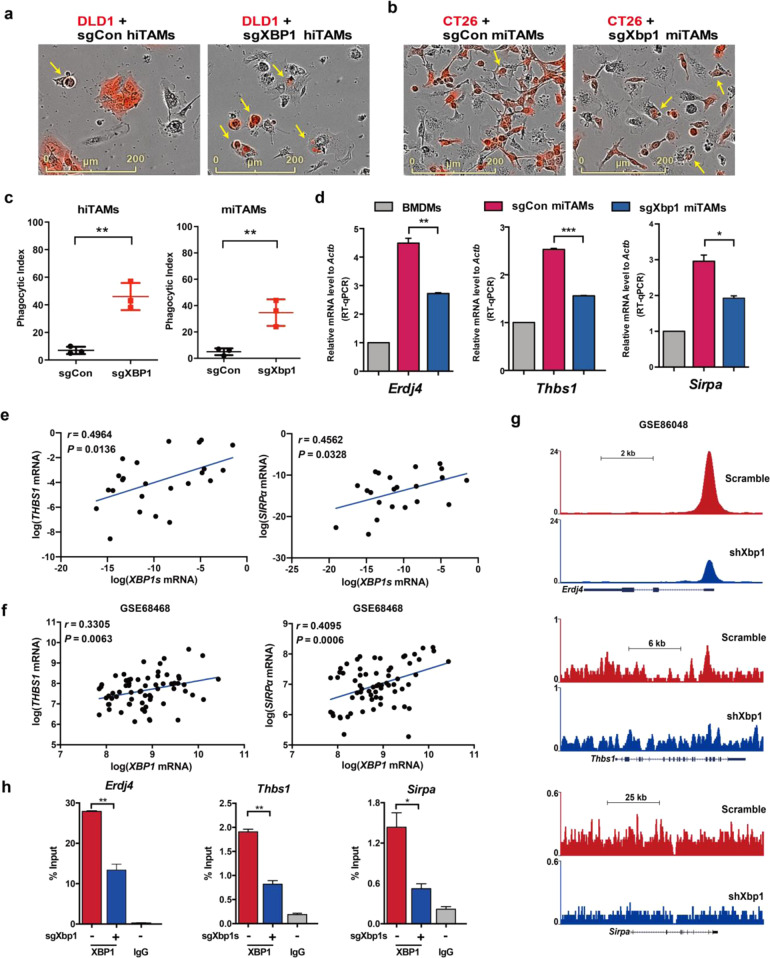
Fig. 5.
Effect of XBP1 on macrophages phagocytosis. a Representative images of phagocytosis assays using RFP-labeled human CRC cell, DLD1cells (DLD1-RFP) and sgCon or sgXBP1 hiTAMs (n = 3). Yellow arrows denote phagocytic events. Scale bar = 200 μm. b Representative images of phagocytosis assays using RFP-labeled mouse CT26 cells (CT26-RFP) and sgCon or sgXbp1 miTAMs (n = 3). Yellow arrows denote phagocytic events. Scale bar = 200 μm. c Results of phagocytosis assays of the two groups in a, b. **P < 0.01; t-test. d Relative mRNA levels of XBP1 and phagocytosis-associated genes in BMDM, sgCon miTAMs and sgXbp1 miTAMs, validated by RT-qPCR. Bars represent mean ± SD of three experimental replicates. *P < 0.05, **P < 0.01, ***P < 0.001; t-test. e Expression of THBS1 and SIRPα versus XBP1 in TAMs sorted from CRC patients (n = 27 total). r, Spearman’s rank correlation test. f Correlation of XBP1 with THBS1 and SIRPα in CRC patients. The association was analyzed using coefficient measures of the linear relationships in the public GEO database (GSE68468). g Track view of Erdj4, Thbs1, and Sipra ChIP-seq density upon silencing of Xbp1 in the ChIP-seq online database (GSE86048). h ChIP-qPCR experiments measuring XBP1 binding on Erdj4, Thbs1, and Sipra segments. Bars represent mean ± SD of three experimental replicates. *P < 0.05, **P < 0.01. P-values were determined using t-test

