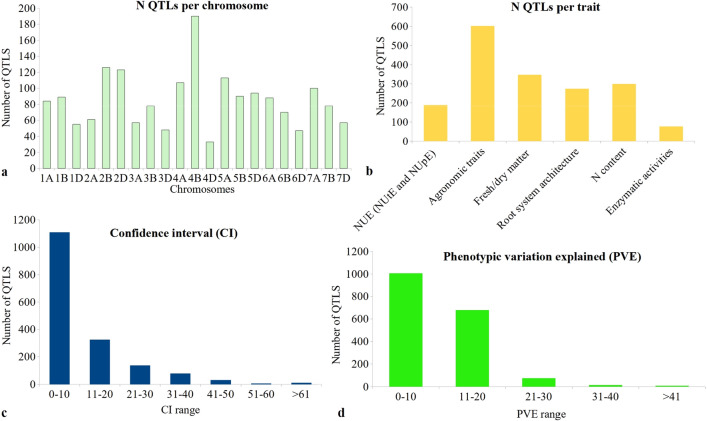
Fig. 1.
Frequencies of QTLs used for identification of MQTLs in wheat, based on four different criteria: a number of QTLs for 21 chromosomes arranged according to 7 homoeologous groups (1–7), each group with three sub-genomes (A, B, D), b frequencies of QTLs for each of the six traits, c frequencies of QTLs with different size of CI (in cM), and d frequencies of QTLs with different levels of phenotypic variation explained (PVE%)

