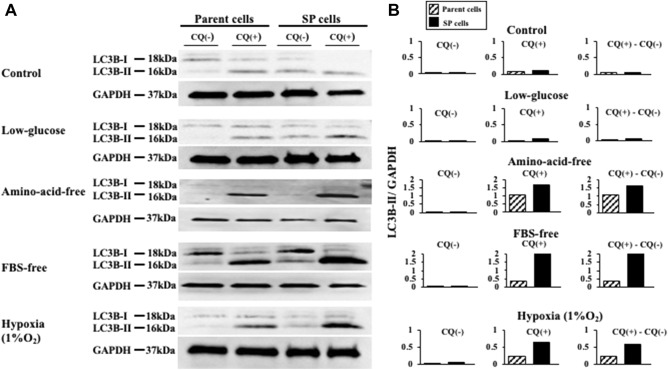
Figure 6.
Autophagy flux of OCUM-12 cells. (A) Autophagy flux assay. (B) Autophagic flux was determined by subtracting the band intensity of the LC3B-II western blot in the presence of chloroquine (CQ +) and the corresponding treatment in the absence of chloroquine (CQ −). The expression of LC3B-II was higher in the OCUM-12/SP cells than in the parent OCUM-12 cells under amino-acid-free, FBS-free, and 1%O2 conditions (LC3B/GAPDH ratio (CQ +)—LC3B/GAPDH ratio (CQ −); 1.61 and 1.07, 2.19 and 0.35, 0.58 and 0.22, respectively). The difference in LC3B-II expression was greatest under the FBS-free medium. The LC3B-II expressions under the control medium and low-glucose medium were slight (0.04 and 0.06, 0.07 and 0.02, respectively). The displayed membrane were cut prior to hybridization. The full-length original, un-processed blot performed with each antibody, LC3B and GAPDH, which confirms specific detection of the target antigen was presented in Supplement Figs. S1 and S2.

