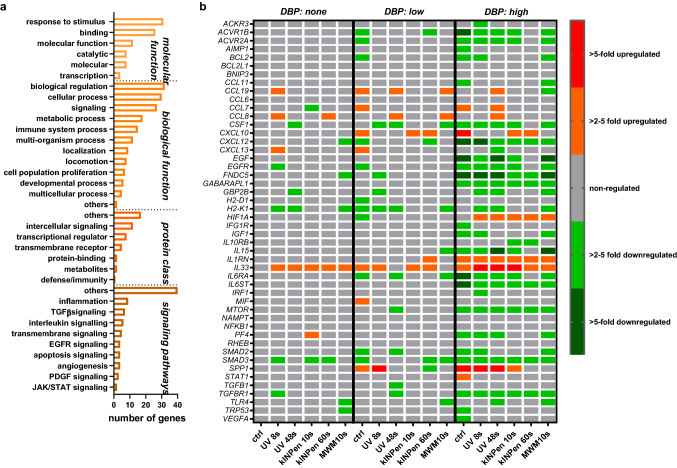
Figure 6.
Gene expression analysis of 49 transcripts expressed and identified across all groups. (a) classification of identified genes across sorted by their occurrence within functions, pathways, and classes; (b) heatmap of relative gene expression for all targets and groups. Data are mean from duplicates of RNA pooled from the mucosa of 5 mice per group and normalized to the house-keeper GAPDH before the second normalization of untreated control mice's respective values.

