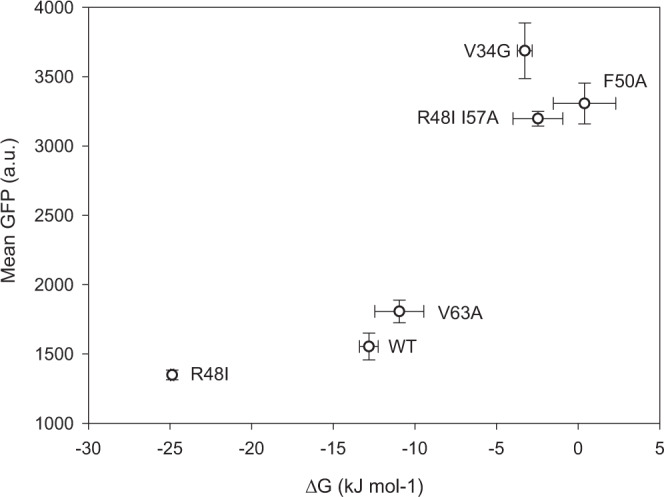
Fig. 4. Correlation between GFP fluorescence and protein stability.

Six CI2 variants were co-expressed with the protein folding sensor (pSEVA631(Sp)-lbpAp-GFP-ASV), and the GFP fluorescence was analyzed by FACS. The average mean GFP fluorescence was compared to the Gibbs free energy of unfolding (∆Gunf) determined from global fits of thermal and chemical unfolding of each protein. All measurements were determined in triplicates and the data are presented as mean values ± standard deviation. Source data are provided as a Source Data file.
