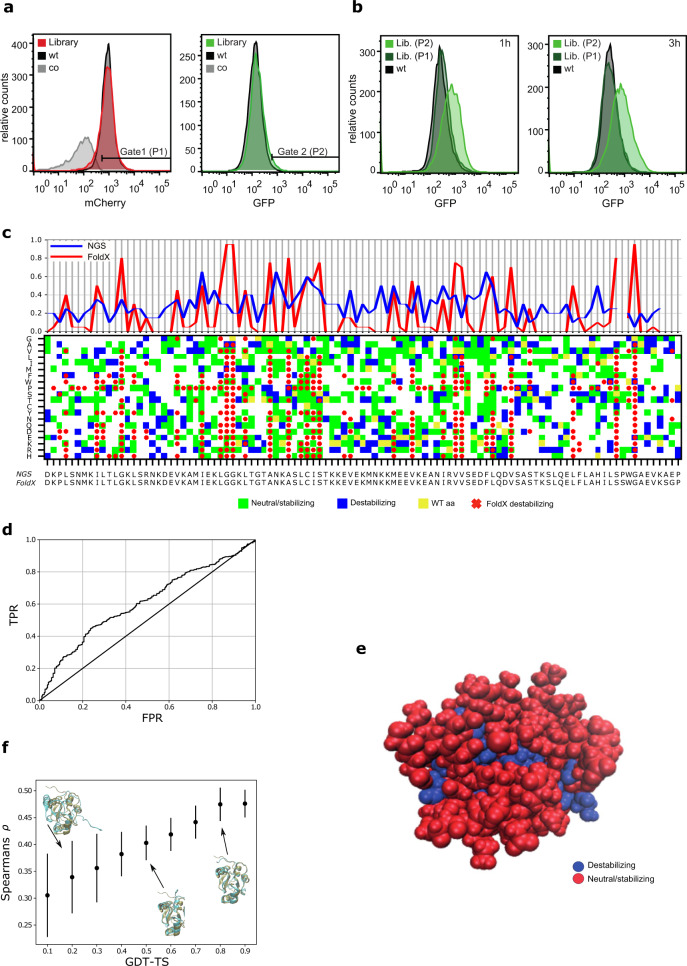
Fig. 5. FACS sorting and deep mutational scanning to identify variants of PARP1-BRTC with decreased protein folding.
a FACS sorting of PARP1-BRCT mutant library (red and green), PARP1-BRCT WT (black), and the translation sensor plasmid without a gene inserted (gray). Cells were sorted for high translation levels (Gate 1) and degree of protein misfolding (Gate 2). b The sorted cells were grown overnight and analyzed by flow cytometry 1 and 3 h after protein expression was induced. c Top: Ratio between the number of destabilizing mutations and the number of total mutations for each amino acid residue for both FoldX (red) and experimental data (blue). Bottom: Matrix plot indicating if an amino acid change (y-axis) of the sequence (x-axis) was destabilizing according to the high-throughput sequencing data as well as for FoldX calculations. For the experimental data, green and blue squares indicate neutral/stabilizing and destabilizing mutations, respectively. Yellow marks the wildtype to wildtype mutants, and white marks mutations with no experimental readout. Red x’s indicate destabilizing mutations according to FoldX, with a cut-off of 3 kcal/mol. All squares without red x’s are predicted to be neutral or stable mutants. d Receiver Operating Characteristic analysis of sequencing data and predicted FoldX ΔΔGs. The sequencing data provides the mutation specific labels (blue vs green in Fig. 5C) and the ΔΔGs predicted from FoldX are the mutation specific scores. e Structural visualization of stable vs destablilizing sequence positions of the PARP1-BRCT structure based on the experimental data. Blue residues that destabilize the protein have a Ndestabl./Ntotal ≥ 0.2, while the remaining are colored red. f Scoring of 20.000 structural decoys based on the experimental data. The plot shows the Spearman’s correlation coefficient, ρ, that quantifies the correlation between residue depth and mutational tolerance based on the experimental data, as well as a structural quality measure defined by the structural Global Distance Test – Total Score (GDT-TS) score, where one corresponds to a native or near native structure. Here, the mean ρ is plotted for structures binned to the closest 0.1 GDT-TS bins. The error bars represent standard deviations for the individual bins. Source data are provided as a Source Data file.

