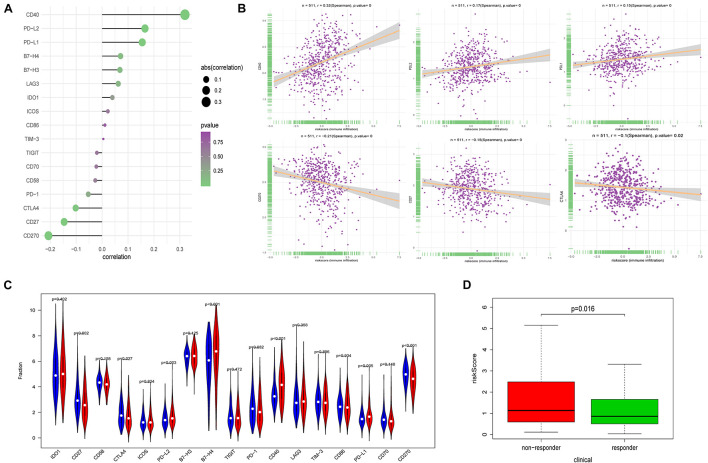
FIGURE 7.
Correlation between FRPS and immune checkpoint molecules and the predicted response to immunotherapy. (A) The association between FRPS and immune checkpoint molecules. (B) The association between FRPS and several immune checkpoint molecules in detail. (C) The landscape of the expression of immune checkpoint molecules in low-risk and high-risk groups. (D) The different immunotherapy response rates in low-risk and high-risk groups.

