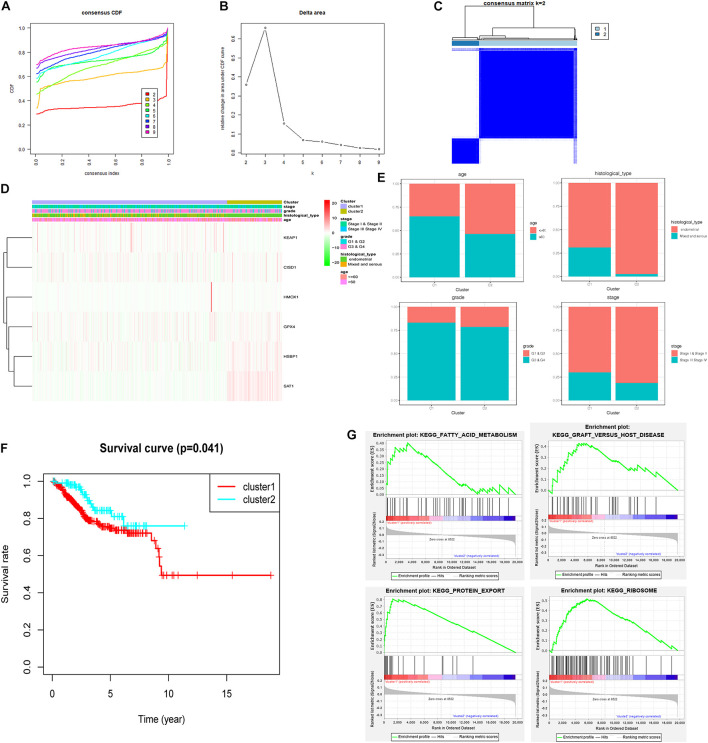
FIGURE 9.
Consensus clustering for ferroptosis-related genes in UCEC patients. (A) Consensus clustering CDF for k = 2 to k = 9. (B) Relative change in area under CDF curve for k = 2 to k = 9. (C) Consensus clustering matrix of UCEC samples from TCGA dataset for k = 2. (D) Heat map of two clusters defined by the six variable expression genes. (E) The proportion of clinical factors in two clusters. (F) K–M survival curve of patients in two clusters. (G) The significantly enriched KEGG pathways in two clusters.

