FIGURE 8.
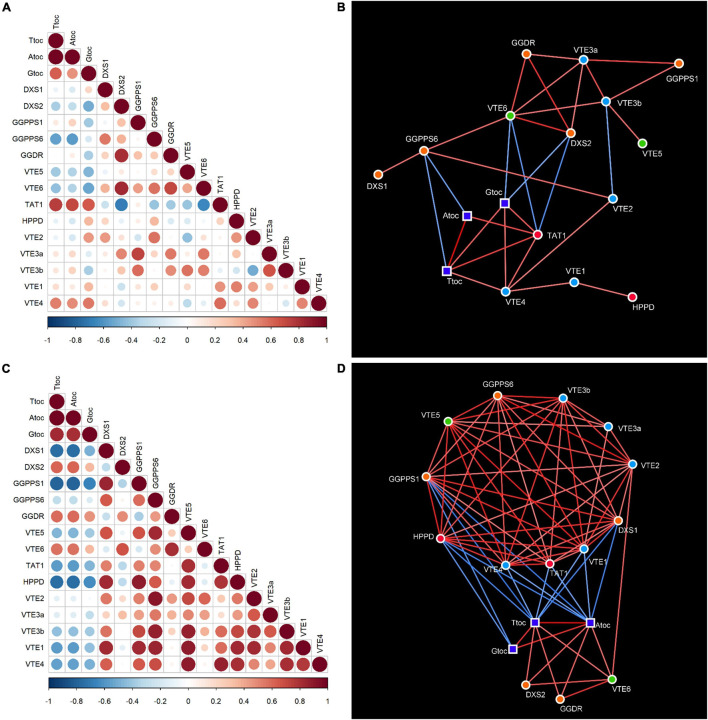
Correlation matrices (A,C) and networks (B,D) of tocopherol contents and expression of genes involved in tocopherol synthesis in the flavedo (A,B) and pulp (C,D) during fruit maturation of grapefruit (C. paradisi), lemon (C. limon), sweet orange (C. sinensis), and mandarin (C. clementine). Positive and negative correlations in the matrices are shown in different shades of red and blue, respectively, with the size of the circle and color intensity indicating the magnitude of Pearson’s correlation coefficient. In the correlation networks, square nodes represent tocopherol contents (Ttoc, total tocopherols; Atoc, α-tocopherol; Gtoc, γ-tocopherol) and circle nodes represent genes (green, genes involved in the recycling of phytol; orange, genes of the MEP pathway; red, genes of the SK pathway; and blue, genes of the tocopherol-core pathway). Lines joining the nodes represent correlations (edges); positive correlations are shown in red, while negative correlations are in blue, and the color intensity represents the strength of the correlation (absolute value of the Pearson’s correlation coefficient). Only significant correlations (p-value ≤ 0.05) were taken into account for constructing the correlation networks. Values for the correlation coefficients and significances are detailed in Supplementary Tables 7, 8, 13, 14.

