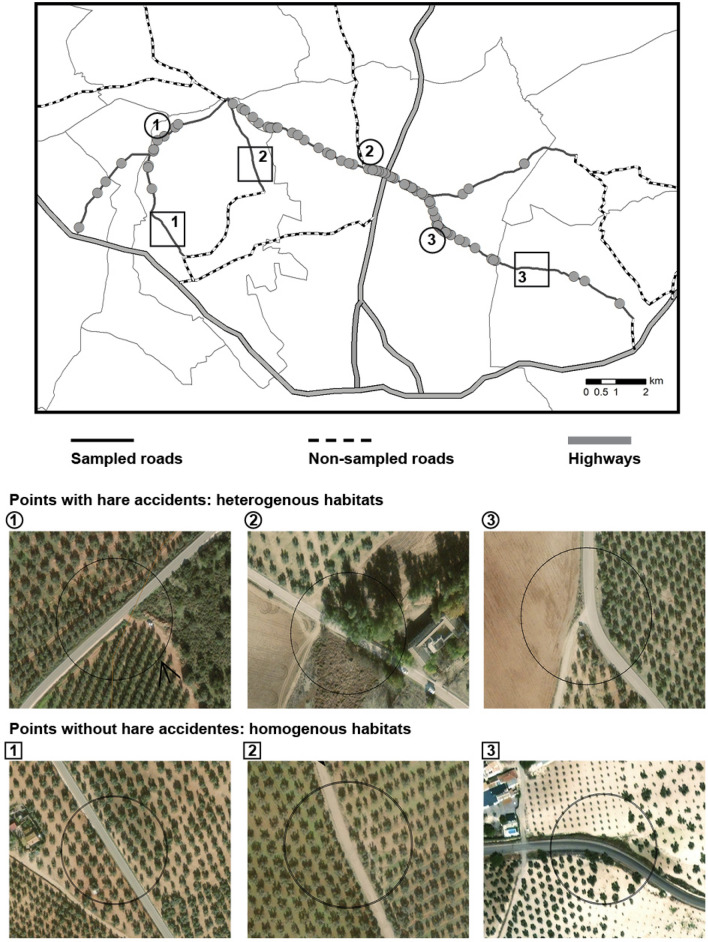
Figure 3.
Representative points along the sampled road network with (heterogeneous habitat) and without (homogeneous habitat) hare accidents. Photographs show habitat within a 100 m buffer around each point; grey circles indicate points with hare roadkill events. Map created with ArcGis 9.3 (ESRI 2008). Datasets from Instituto de Estadística y Cartografía de Andalucía, Junta de Andalucía. Road network and administrative boundaries (https://www.ideandalucia.es/catalogo/inspire/srv/spa/catalog.search#/home) Ortophotography (https://www.juntadeandalucia.es/institutodeestadisticaycartografia/prodCartografia/ortofotografias/index.htm).

