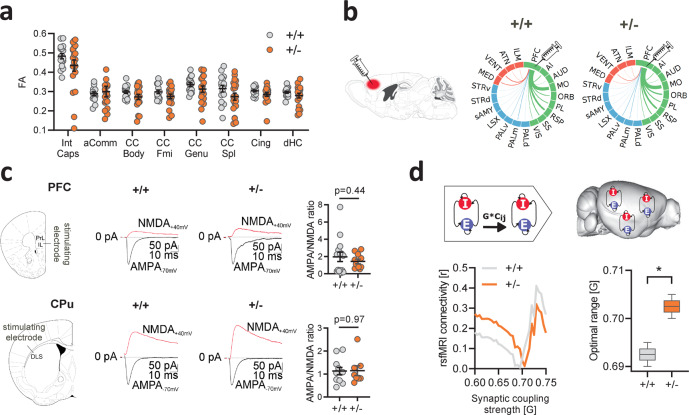
Fig. 2. Increased synaptic coupling explains functional hyperconnectivity in Tsc2+/− mice.
a Fractional anisotropy (FA) quantification in the anterior commissure, corpus callosum, cingulate, dorsal hippocampus, and internal capsule as assessed with diffusion-weighted imaging. Intergroup comparisons showed preserved FA in Tsc2+/− mutant mice with respect to control littermates. Int Caps internal capsule, aComm anterior commissure, CC Body body of the corpus callosum, CC Fmi forcep minor of the corpus callosum, CC Genu genu of the corpus callosum, CC Spl splenium of the corpus callosum, Cing cingulum, dHC dorsal hippocampus. n = 20 mice for each group. Error bars represent SEM. b Regional quantification of retrogradely labeled cells as probed with the injection of recombinant rabies virus in the prefrontal cortex. The thickness of the links in the circular layouts is proportional to the relative number of labeled cells. Cortical areas are depicted in green, subcortical regions in blue, and thalamic areas in red. No differences were observed between in Tsc2+/− and Tsc2+/+ mice in any of the examined regions. PFC prefrontal cortex, AI agranular insular cortex, AUD auditory cortex, MO motor cortex, ORB orbitofrontal cortex, PL prelimbic cortex, RSP retrosplenial cortex, SS somatosensory cortex, VIS visual cortex, PALd globus pallidus (dorsal part), PALm globus pallidus (medial part), PALv globus pallidus (ventral part), LSX lateral septal complex, sAMY striatum-like amygdalar nuclei, STRd striatum (dorsal part), STRv striatum (ventral part), MED medial thalamus, VENT ventral thalamus, ATN anterior thalamus, ILM intralaminar thalamus. c Intracellular electrophysiological recordings in prefrontal and striatal neurons of Tsc2+/− mutant and control mice. Intergroup comparisons revealed comparable AMPA/NMDA ratio in Tsc2+/− and Tsc2+/+ mice in both the regions probed (PFC, unpaired t test, two-sided, t = 0.79, P = 0.44; CPu, unpaired t test, two-sided, t = 0.07, P = 0.97). PFC prefrontal cortex, PrL prelimbic, IL infralimbic, CPu striatum, DLS dorsolateral striatum. PFC, n = 15 mice (+/+), n = 11 mice (+/−); CPu, n = 11 mice (+/+), n = 8 mice (+/−). Error bars represent SEM. d Whole-brain network modeling44 was carried out to probe a putative mechanistic link between interareal coupling strength (G) to empirical measurements of whole-brain rsfMRI connectivity (left). Optimal G was selected on the basis of the minimal difference between modeled and empirical rsfMRI connectivity (y axis) for both genotypes (middle). Intergroup differences (permutation-based unpaired t-test, two-sided, Gdiff = 0.010, P = 0.030) revealed higher optimal G in Tsc2+/− vs. control mice (right). n = 20 mice for each group. Box and whiskers: Tsc2+/+, min = 0.6900, max = 0.6950, centre = 0.6925, bounds of box and whiskers = 0.6912–0.6933, quartiles; Tsc2+/−, min = 0.7000, max = 0.7050, centre = 0.7025, bounds of box and whiskers = 0.7012–0.7033, quartiles. *P < 0.05. Source data are provided as a Source Data file.

