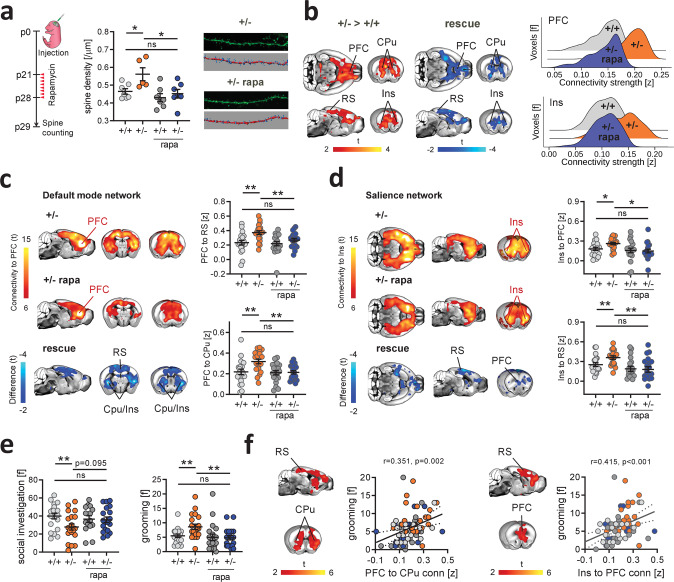
Fig. 3. Pharmacological mTOR inhibition rescues synaptic surplus, functional hyperconnectivity, and autism-like behavior in Tsc2+/− mice.
a Experimental design of spine density measurements (left). Developmental treatment with the mTOR inhibitor rapamycin normalized dendritic spine density in rapamycin-treated Tsc2+/− mice (+/− rapa) to the level of vehicle-treated Tsc2+/+ control mice (+/+). n = 7 mice (+/+, +/− rapa, and +/+ rapa) and n = 5 mice (+/−). b Voxelwise rsfMRI mapping showed a pattern of decreased long-range functional connectivity in rapamycin-treated Tsc2+/− mice (blue), recapitulating the anatomical regions showing increased rsfMRI connectivity in Tsc2+/− mice (red–yellow coloring, left). Rescue here denotes the effect of rapamycin in Tsc2+/− mutants i.e., areas of decreased rsfMRI connectivity in rapamycin-treated vs. vehicle-treated Tsc2+/− mice. Global histogram analysis confirmed the rescue of long-range hyperconnectivity in prefrontal and insular regions of rapamycin-treated mutants (right). c Spatial extension of the mouse default-mode network in the vehicle- (top) and rapamycin- (bottom) treated Tsc2+/− mice. Between-group connectivity mapping and regional quantifications revealed that treatment with rapamycin rescued prefrontal rsfMRI hyperconnectivity in Tsc2+/− mice to levels comparable to control mice (right). n = 20 mice for each group. d Spatial extension of the salience network in the vehicle- (top) and rapamycin- (bottom) treated Tsc2+/− mice. Rapamycin completely rescued salience network hyperconnectivity in rapamycin-treated Tsc2+/− mice. Rescue in (c) and (d) denotes the effect of rapamycin in Tsc2+/− mutants i.e., areas of decreased rsfMRI connectivity in rapamycin-treated vs. vehicle-treated Tsc2+/- mice. n = 20 mice for each group. e Rapamycin also rescued altered self-grooming and social behaviors in Tsc2+/− rapa mice. Grooming, mice, n = 20 (+/+), n = 20 (+/−), n = 19 (+/+ rapa), n = 19 (+/− rapa). Social investigation, mice, n = 20 (+/+), n = 20 (+/−), n = 15 (+/+ rapa), n = 19 (+/− rapa). f Voxelwise correlation mapping revealed a significant positive correlation between prefrontal (left, Pearson’s r, r = 0.351, P = 0.002) and insular (right, Pearson’s r, r = 0.415, P < 0.001) rsfMRI connectivity, and motor stereotypes. PFC prefrontal cortex, CPu striatum, RS retrosplenial cortex, Ins insular cortex. Scatterplots represent the quantification of these correlations in the striatum and PFC, respectively. *q < 0.05, **q < 0.01, all FDR-corrected. Error bars represent SEM. Source data are provided as a Source Data file.

