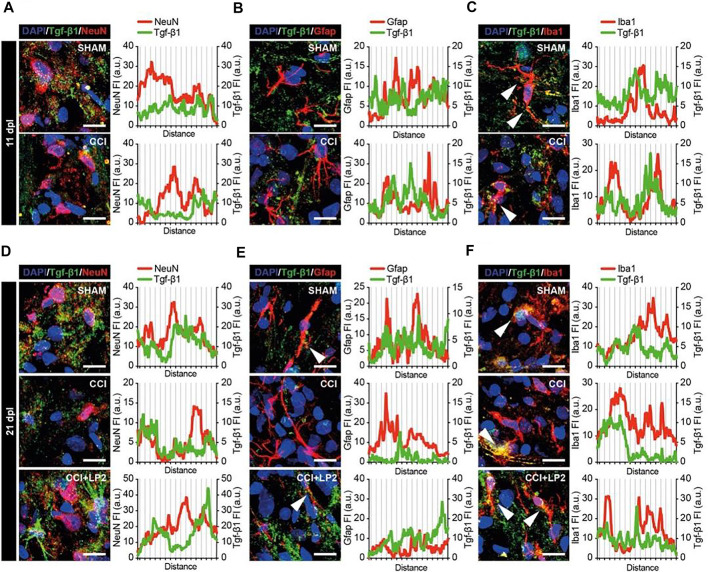
FIGURE 5.
TGF-β1 profile in neurons, astrocytes and microglial cells in ipsilateral dorsal horns of CCI spinal cord. Representative confocal images of TGF-β1 (green) and NeuN (red in A–D), GFAP (red in B–E) and Iba1 (red in C–F) immunohistofluorescence analysis in ipsilateral dorsal horns of SHAM and CCI rats at 11 dpl (A–C) and of SHAM, CCI and CCI + LP2 treated rats at 21 dpl (D–F). Scale bars 10 μm. Profile plots of mean fluorescence intensity, expressed as arbitrary units (a.u.), are also shown.

