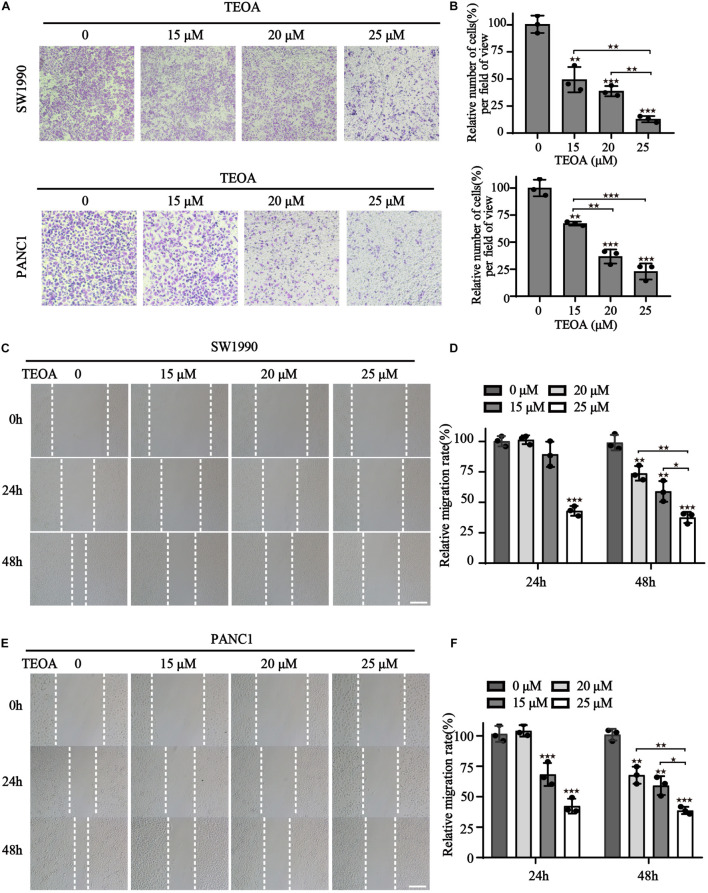
FIGURE 2.
TEOA suppressed migration of SW1990 and PANC1 cells. (A) Migration of PANC1 and SW1990 cells treated with 0, 15, 20, 25 μM TEOA for 24 h was determined using the transwell assay. (B) Statistical analysis of the migration cells. (C–F) Scratch wound healing assay was used to detect the migration capability of cells with the indicated concentrations of TEOA and representative microscopic images were showing in the (C,E). Relative migration distance was quantified and shown on the right (★p < 0.05; ★★p < 0.01; ★★★p < 0.001, versus control).

