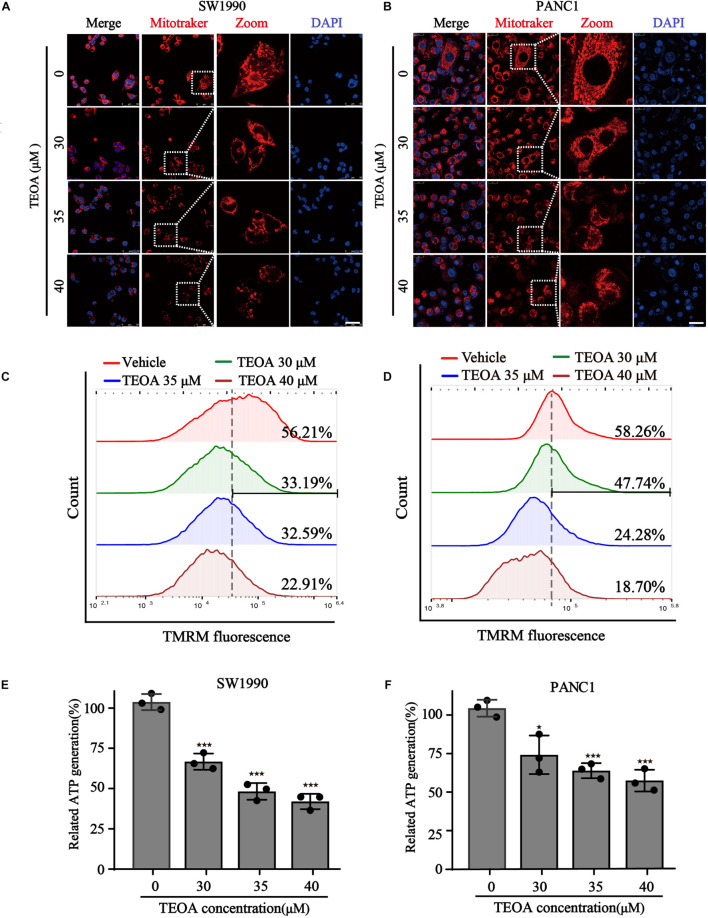
FIGURE 3.
TEOA induced mitochondrial dysfunction of pancreatic cancer cells. (A,B) To observe the morphology of mitochondria, SW1990 and PANC1 cells treated with the indicated concentration of TEOA for 8 h and stained with Mitotracker probe (200 nM), DAPI (10 μg/ml), and then photographed by confocal laser microscope. Scale bars 50 μm. (C,D) To assess the changes of mitochondria membrane potential, TEOA treated SW1990 cells and PANC1 cells were stained with TMRM probe for 30 min and followed by flow cytometry measurement. (E,F) SW1990 and PANC1 cells were treated with the indicated concentration of TEOA, then ATP levels were measured. ATP levels of TEOA treated PANC1 cells were measured (★p < 0.05; ★★p < 0.01; ★★★p < 0.001, versus control).

