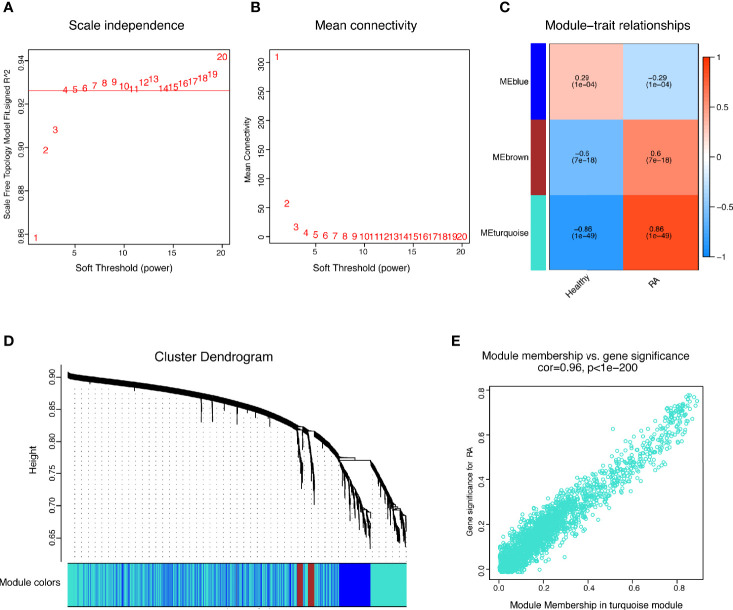
Figure 5.
WGCNA revealed gene co-expression networks in the whole peripheral blood of 169 RA patients. (A, B) Analysis of the scale-free fit index and the mean connectivity for various soft-thresholding powers; (C) Relationships of consensus modules with samples. It contains a set of highly linked genes. Each specified color represents a specific gene module; (D) Clustering dendrogram of differentially expressed genes related to RA; (E) The gene significance for RA in the turquoise module (one dot represents one gene in the turquoise module).

