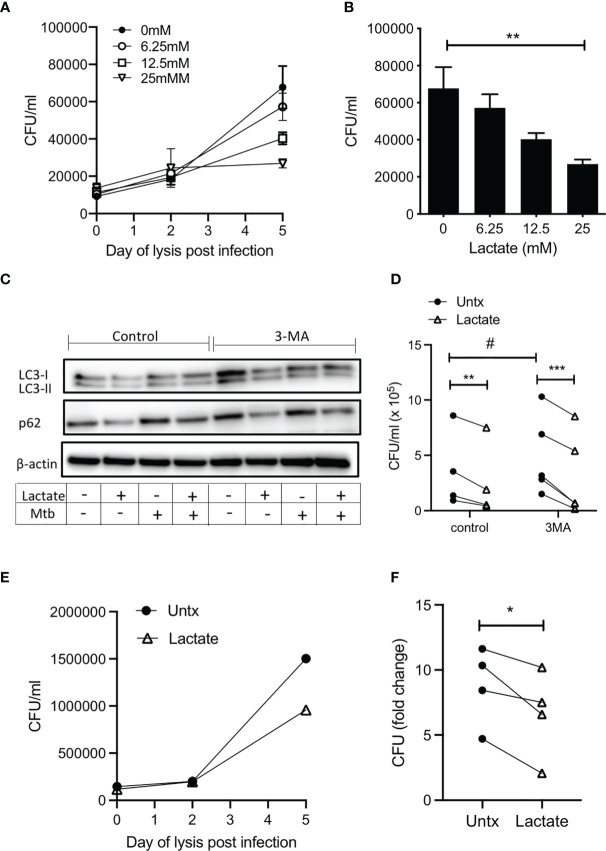
Figure 4.
Lactate improves human MDM killing of Mtb by promoting autophagy. PBMC were isolated from buffy coats and MDM were adherence purified for 7 days in 10% human serum. (A–D) MDM were left untreated or treated with 6.25, 12.5 or 25 mM of lactate for three hours prior to infection with Mtb (H37Ra) at a MOI of 30-40% infectivity, 1-5 mycobacteria per cell (as defined by auramine O staining) and were then lysed on day 0 (3 hours post-infection), day 2 and day 5 and plated on Middlebrook 7H10 agar (+OADC). CFU were enumerated 21 days after plating. The time course graph shows the CFU results at day 0, 3 and 5 for each of the lactate concentrations (A); n=5± SD). The differences in CFU growth for each concertation of lactate at the day 5 time point are graphed in (B) (n=5 ± SD). Cells were treated with the autophagy inhibitor, 3MA (5 µM), in the presence or absence of lactate (25 mM) 1 hour prior to infection with H37Ra. Cells were lysed 24 hours post infection and the expression of LC3-I, LC3-II, p62 and β-actin were determined by Western Blotting (C); representative blot of n=4 experiments). Cells were lysed 5 days post infection to enumerate CFU (D); n=4. (E, F) MDM were treated with lactate (25 mM) for 3 hours prior to infection with H37Rv at a MOI of 30-40% infectivity, 1-5 mycobacteria per cell (as defined by auramine O staining) and were then lysed on day 0 (3 hours post-infection), day 2 and day 5 and plated on Middlebrook 7H10 agar (+OADC). CFU were enumerated 21 days after plating. Representative growth curve of H37Rv over time in untreated compared with lactate treated human MDM (E). Collated data showing the fold change in CFU on day 5 relative to day 0 controls (F); n=4. Statistical significance was determined using one-way or two-way ANOVA, as appropriate, with Tukey’s or Sidak’s comparison test; **P < 0.01, ***P < 0.001, or paired Student’s t-test; *P < 0.05, # P< 0.05.

