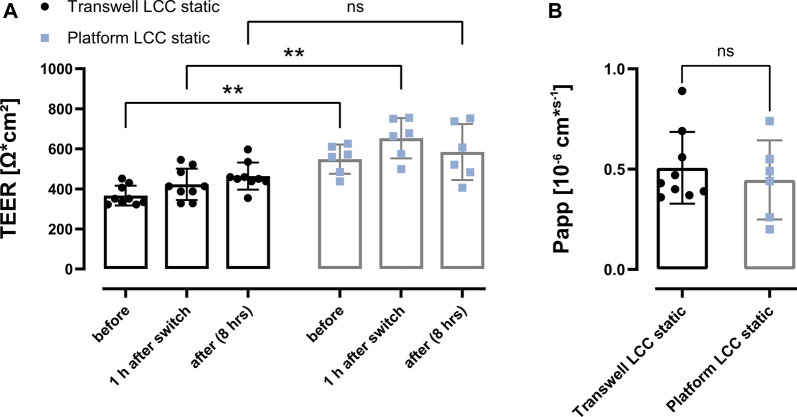
FIGURE 6.
Comparison of fluorescein sodium transport between Transwell and the perfusable platform under LCC. (A) Transport studies were performed on Calu-3 cells (LCC: d17-d19). TEER values were measured before the experiment (before), 1 h after the incubation in transport buffer (1 h after switch), as well as after the transport study (after) and indicated a stable barrier during the transport. (B) Apparent permeability (Papp) of fluorescein sodium (2.5 μg/ml (dose: 500 ng on Transwell; 212 ng on platform)) applied as a solution. Papp was determined after the transport study (7 h). Data represent mean ± S.D. (A) 2-way ANOVA was performed not assuming sphericity and with a Šídák´s multiple comparisons test, ns: p > 0.5; *: p < 0.05; **: p < 0.005; (B) Unpaired t-test was performed with Welch`s Correction; Transwell LCC: n = 9, Platform LCC: n = 6 out of 3 independent experiments.

