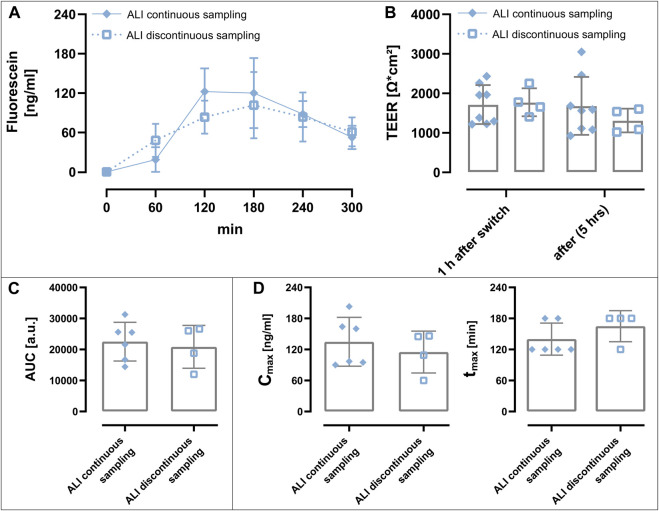
FIGURE 7.
Transport studies under perfusion after ALI deposition. (A) Concentration time curve of nebulized fluorescein sodium (dose: 212 ng in PBS). Samples were collected every hour either sampled continuously from perfusion (80 μl/h) generated by a peristaltic pump or discontinuously (80 µl) via a short perfusion with a syringe pump. During the transport study, samples termed “ALI continuous sampling” were thus constantly perfused, while samples termed “ALI discontinuous sampling” were shaked at 150 rpm and only shortly perfused with a syringe pump during sample collection. 80 µl sample volume was collected for both conditions every hour. (B) TEER values 1 h after switching from ALI to LCC in order to determine the TEER before the transport study (1 h after switch) and at the end of the 5 h transport experiment [after (5 h)] was unchanged, indicating that epithelial barrier function was not affected by perfusion. (C) The area under the concentration time curve (AUC) was comparable between the two conditions. (D) The maximal concentrations (Cmax; left) as well as the time to reach the highest concentration (tmax, right) did not significantly differ and were rather comparable for both conditions. Data represent mean ± S.D.; ALI continuous sampling n = 6 out of 3 independent experiments, ALI discontinuous sampling n = 4 out of 4 independent experiments.

