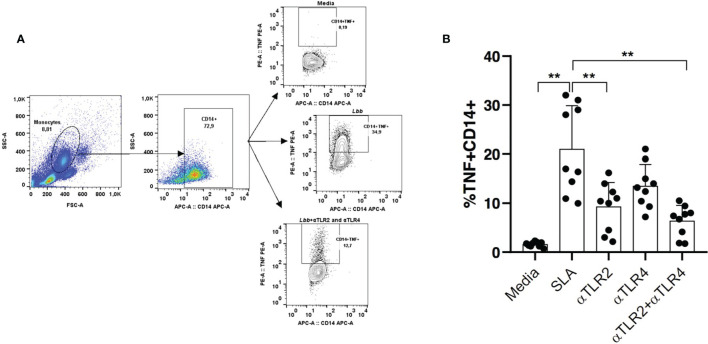
Figure 6.
The TNF production after stimulation with leishmania soluble antigen (SLA) and TLR2 and TLR4 neutralization. Monocytes from CL patients (n = 10) were treated or not with anti-TLR2 and anti-TLR4 antibodies. Cells were stimulated with SLA for 8 hours. (A) The positive florescence in the population cells were obtained by the strategy using FMO (Florescence Minus One). The frequency of cells expressing TNF in CD14+ cells (B) was performed by the flow cytometry technique. All p values were obtained using Wilcoxon’s statistical test **p<0.01.

