
Figure 1.
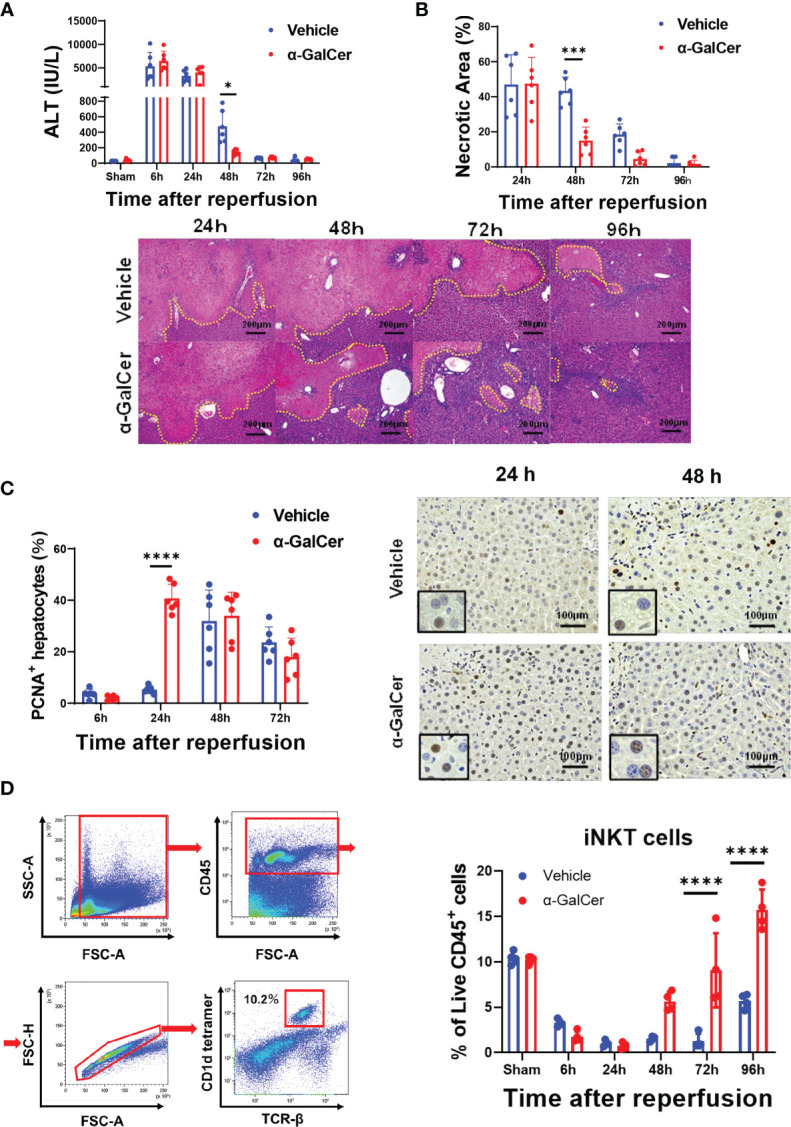
Activation of iNKT cells facilitates liver repair after hepatic I/R injury. (A, B) Changes in ALT levels (A) and hepatic necrotic area (B) in mice treated with α-GalCer and vehicle after hepatic I/R injury. Data are expressed as the mean ± SD (six biological replicates per group). *P < 0.05, ***P < 0.001. Representative photomicrographs of H&E-stained liver sections from mice treated with α-GalCer or vehicle after hepatic I/R injury. Scale bars, 200 μm. (C) Changes in PCNA+-hepatocytes in mice treated with α-GalCer or vehicle. Data are expressed as the mean ± SD (six biological replicates per group). ****P < 0.0001. Representative images showing immunohistochemical staining of PCNA in mice treated with α-GalCer or vehicle at 24 h and 48 h post-reperfusion. Large and round cells are considered hepatocytes, and typical labeled hepatocytes are shown at the lower left corner. Scale bar, 100 μm. (D) Representative dot plots and the gating strategy for iNKT cells in sham-operated mice. Changes in hepatic iNKT cells in mice treated with α-GalCer or vehicle after hepatic I/R injury. Data are expressed as the mean ± SD (four biological replicates per group). ****P < 0.0001.