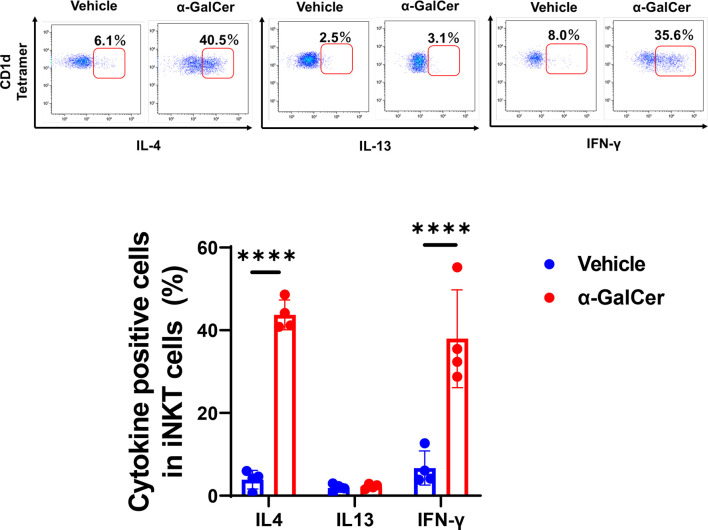
Figure 3.
Production of cytokines from iNKT cells after hepatic I/R injury. Representative dot plots in liver iNKT cells at 6 h post-reperfusion (upper panels). The percentage of IL-4-, IL-13-, and IFN-γ-positive cells in iNKT cells in mice treated with α-GalCer or vehicle (lower panel). Data are expressed as the mean ± SD (four biological replicates per group). ****P < 0.0001.

